Mullet River Testing
Mullet River Testing. Joe Chandler, Connor McManus, Trevor Horneck , and Gwen Nytes. Overview.

Mullet River Testing
E N D
Presentation Transcript
Mullet River Testing Joe Chandler, Connor McManus, Trevor Horneck, and Gwen Nytes
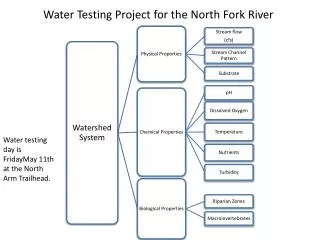
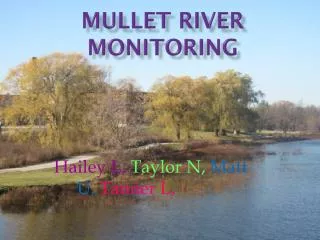
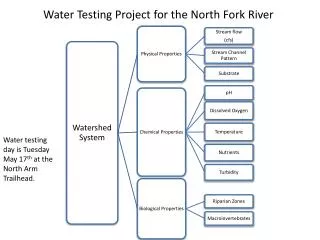
Overview Our project was to determine the health of the Mullet River. We did many tests at our site to help us come to conclusions. We did a habitat assessment, collected and identified macroinvertebrates, and chose 3 water quality tests to complete. Our group performed the phosphate, dissolved oxygen, and pH tests, but also looked at other group’s data to help us decide the river’s health.
Overall Health We’ve discovered that the river isn’t very healthy. Many of the tests we looked at had poor results. We also found out that most of the test outcomes occurred because of the silt and mud in the river. Because there is so much mud piled at the bottom, it causes extremely shallow water depths.
Sources of the Health • There are many point and non-point sources contributing to the river’s health. They can affect the health from any point in the river. Some of these are: • Storm drains • Runoff • Septic systems • Dump leakage • Another major problem is the mud, which is caused from all of the organisms that die and pile up on the bottom. This affects the results of our tests.
Habitat Assessment • This was the very first test that we looked at. When we added the 10 parameters together, we got a score of 32/52. A couple of the major categories we lost points on were: • The riparian zone • There is hardly any riparian vegetation along the banks. This means that there is no stopping the flow of runoff into the river. • In-stream habitat for fish • It’s easy to see that there aren’t many fish in the river. It’s too shallow, and there aren’t any places for them to live.
Macroinvertebrates Next, we went into the river and collected macroinvertebrates. Using the Dichotomous Key, we identified each organism we found. We placed them into groups based on their sensitivity to pollution. We didn’t find any in Group 1, which are sensitive to pollutants, but we found organisms that fit into every other category. The further they are down the list, it means that they can tolerate higher levels of pollution and very low levels of oxygen. This is a good indicator of how little oxygen is present in the river.
Dissolved Oxygen • We performed this test in the morning on two different days. The first day, it was pouring and cold, giving us an oxygen level of 47%. We got 84% the next day, when it was warm and partly cloudy. • While looking at other groups’ data from other times during the day, the percents were considerably different. Since the numbers go up and down so much, it means there is bacteria in the water that’s using the dissolved oxygen faster than it can be produced.* • Another factor that influences the changing percentages is the water temperature. The water is so shallow it can’t maintain a constant temperature. *(USGS. (2013, May 23). USGS: Dissolved Oxygen. Retrieved June 3, 2013, from USGS: http://ga.water.usgs.gov/edu/dissolvedoxygen.html)
Biological Oxygen Demand This test is done to show how much bacteria is present in the water. When the sample of water for this test was collected, it had a dissolved oxygen level of 95%. It sat in the dark for 5 days, and when it was tested for the second time, the level was all the way down to 0%. This further proves how many bacteria are in the river, and how fast the oxygen is being used up.
pH • We tested the pH of the Mullet two times, and got good results. One day was cold and pouring rain and the other was warm and dry with no clouds. Both tests were taken in the morning. • The sunny day we got a 7 pH. This is the best score, meaning that it’s pure water. The organisms in the water usually like a 7 but most can tolerate fluctuation of the 7 to a 6 or 8. The rainy day we got an 8 which compared with other groups stays pretty consistent.
Phosphates • Both times when we took this test it resulted in a zero, meaning there were no phosphates in the water. However, we know that there are a bunch entering the river. One day, we could actually see oil on top of the water. This is an obvious sign that there are phosphates coming in. • The reason we got zero as the outcome is because of the bacteria again. All living things need phosphates to survive, but there’s an extreme amount of bacteria using it all up. This is also why it’s hard to find other plants and animals living in the river.* *Riverview Science. (2013, May). Water Monitoring: Phosphatest. Retrieved June 3, 2013, from Riverview Science: http://hoopmanscience.pbworks.com/w/page/47827886/Water%20Monitoring%3A%20%20Phosphates
Solution to the Problem • Our group believes the best approach to improving the condition of the Mullet is to dredge it. • Dredging can help this river by getting all the mud out. When the mud and silt is gone, the bacteria won’t have anything to survive off of, so it won’t come back. With the bacteria out of the river, all of the necessary nutrients and oxygen will be able to spread around and supply many more organisms. • Besides being able to sustain plant and animal life, dredging will also restore the water depth to what it originally was. The Mullet could be the recreational hot spot that it used to be.
Lake Leota, Evansville • Evansville’s mill pond was in the same situation that ours is now. Silt had piled up on the bottom, leaving the depth no deeper than 18 inches. Their method of restoring it was also dredging. Today, Lake Leota in Evansville has earned back its recreational value.* • If we take similar steps to what they’ve done to their lake, the Mullet River will return to the state it was in 50 years ago. *Evansville City Hall. (n.d.). Evansville: Lake Leota. Retrieved June 4, 2013, from Evansville: Information for Residents: http://www.ci.evansville.wi.gov/residents/LakeLeota.html
Dredging • To dredge the river, taxes will have to be increased to raise enough money for this process. Another drawback is that there isn’t currently a place to put the silt that’s removed. We could spread it in farm fields, but that could be a concern because of the heavy metals that are in the mud. • Over time, this mud will build up again. With slow moving water, the organisms that die will eventually distribute on the bottom and stay there. If we dredge, the same steps will have to be taken in another 50 years or so.
Bibliography • Evansville City Hall. (n.d.). Evansville: Lake Leota. Retrieved June 4, 2013, from Evansville: Information for Residents: http://www.ci.evansville.wi.gov/residents/LakeLeota.html • Riverview Science. (2013, May). Water Monitoring: Phosphatest. Retrieved June 3, 2013, from Riverview Science: http://hoopmanscience.pbworks.com/w/page/47827886/Water%20Monitoring%3A%20%20Phosphates • USGS. (2013, May 23). USGS: Dissolved Oxygen. Retrieved June 3, 2013, from USGS: http://ga.water.usgs.gov/edu/dissolvedoxygen.html