Download
1 / 71
710 likes | 849 Vues
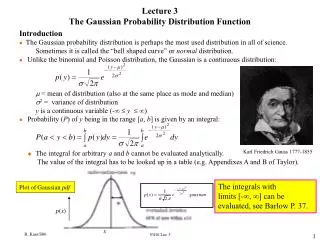
Statistical Theory; Why is the Gaussian Distribution so popular?. Rob Nicholls MRC LMB Statistics Course 2014. Contents. Continuous Random Variables Expectation and Variance Moments The Law of Large Numbers (LLN) The Central Limit Theorem (CLT).

E N D
Statistical Theory;Why is the Gaussian Distributionso popular? Rob Nicholls MRC LMB Statistics Course 2014
Contents Continuous Random Variables Expectation and Variance Moments The Law of Large Numbers (LLN) The Central Limit Theorem (CLT)
A Random Variable is an object whose value is determined by chance, i.e. random events Probability that the random variable X adopts a particular value x: : discrete : continuous Continuous Random Variables
Continuous Uniform Distribution: Probability Density Function: Continuous Random Variables
Example: Continuous Random Variables
Example: Continuous Random Variables
Example: Continuous Random Variables
Example: Continuous Random Variables
Example: Continuous Random Variables
Example: Continuous Random Variables In general, for any continuous random variable X:
: discrete • : continuous Continuous Random Variables • “Why do I observe a value if there’s no probability of observing it?!” • Answers: • Data are discrete • You don’t actually observe the value – precision error • Some value must occur… even though the probability of observing any particular value is infinitely small
Continuous Random Variables For a random variable: The Cumulative Distribution Function (CDF) is defined as: (discrete/continuous) Properties: Non-decreasing
Continuous Random Variables Probability Density function: Cumulative Distribution function: Boxplot:
Continuous Random Variables Probability Density function: Cumulative Distribution function: Boxplot:
Continuous Random Variables Probability Density function: Cumulative Distribution function: Boxplot:
Continuous Random Variables Probability Density function: Cumulative Distribution function: Boxplot:
Continuous Random Variables Probability Density function: Cumulative Distribution function: Boxplot:
Continuous Random Variables Probability Density function: Cumulative Distribution function: Boxplot:
Continuous Random Variables Probability Density function: Cumulative Distribution function: Boxplot:
Continuous Random Variables Probability Density function: Cumulative Distribution function: Boxplot:
Continuous Random Variables Probability Density function: Cumulative Distribution function: Boxplot:
Continuous Random Variables Probability Density function: Cumulative Distribution function: Boxplot:
Continuous Random Variables Probability Density function: Cumulative Distribution function: Boxplot:
Continuous Random Variables Cumulative Distribution Function (CDF): Discrete: Continuous: Probability Density Function (PDF): Discrete: Continuous:
Expectation and Variance Motivational Example: Experiment on Plant Growth (inbuilt R dataset) - compares yields obtained under different conditions
Expectation and Variance Compare means to test for differences Consider variance (and shape) of the distributions – help choose appropriate prior/protocol Assess uncertainty of parameter estimates – allow hypothesis testing Motivational Example: Experiment on Plant Growth (inbuilt R dataset) - compares yields obtained under different conditions
Expectation and Variance Compare means to test for differences Consider variance (and shape) of the distributions – help choose appropriate prior/protocol Assess uncertainty of parameter estimates – allow hypothesis testing Motivational Example: Experiment on Plant Growth (inbuilt R dataset) - compares yields obtained under different conditions • In order to do any of this, we need to know how to describe distributions • i.e. we need to know how to work with descriptive statistics
Expectation and Variance Discrete RV: Sample (empirical): (explicit weighting not required) Continuous RV:
Expectation and Variance Normal Distribution:
Expectation and Variance Normal Distribution:
Expectation and Variance Standard Cauchy Distribution: (also called Lorentz)
Expectation and Variance Linearity: Expectation of a function of random variables:
Expectation and Variance X ~ N(0,1) Variance:
Expectation and Variance X ~ N(0,1) Variance:
Expectation and Variance X ~ N(0,1) X ~ N(0,2) Variance:
Expectation and Variance X ~ N(0,1) X ~ N(0,2) Population Variance: Unbiased Sample Variance: Variance:
Standard deviation (s.d.): Expectation and Variance Non-linearity: Variance:
Standard deviation (s.d.): Expectation and Variance Non-linearity: Variance:
Standard deviation (s.d.): Expectation and Variance Non-linearity: Variance:
Standard deviation (s.d.): Expectation and Variance Non-linearity: Variance:
Standard deviation (s.d.): Expectation and Variance Non-linearity: Variance:
Expectation and Variance Often data are standardised/normalised Z-score/value: Example:
Moments Shape descriptors Li and Hartley (2006) Computer Vision Saupe and Vranic (2001) Springer
Moments Shape descriptors Li and Hartley (2006) Computer Vision Saupe and Vranic (2001) Springer
Moments Shape descriptors Li and Hartley (2006) Computer Vision Saupe and Vranic (2001) Springer
Moments : mean : variance Moments provide a description of the shape of a distribution Raw moments Central moments Standardised moments : skewness : kurtosis
Moments Standard Normal: Standard Log-Normal:
Moments • Alternative representation of a probability distribution. Moment generating function (MGF):
Moments • Alternative representation of a probability distribution. Moment generating function (MGF): • Example:
Moments • Characteristic function always exists: However, MGF only exists if E(Xn) exists • Related to the probability density function via Fourier transform • Example: