Download
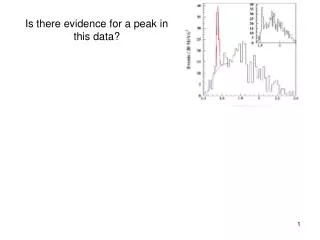
1 / 32
320 likes | 448 Vues
The Lyman- halo of B2 0902+34: Evidence for infall of extended HI. Joshua Adams & Gary Hill University of Texas, Austin Department of Astronomy 3D2008 ESO Workshop Garching, 6-13-08. Overview. High Redshift Radio Galaxy (HzRG) Lyman- halo s cience motivation

E N D
The Lyman- halo of B2 0902+34:Evidence for infall of extended HI Joshua Adams & Gary Hill University of Texas, Austin Department of Astronomy 3D2008 ESO Workshop Garching, 6-13-08
Overview • High Redshift Radio Galaxy (HzRG) Lyman- halo science motivation • New integral field spectroscopy data on B2 0902+34 • New Monte Carlo resonant scattering model • Future observations and model discrimination
Why bother with HzRG halos? “While LABs are known to exist around radio-loud quasars, they are attributable to known jets and supernova-driven outflows, and we do not attempt to model them here.” Dijkstra et al. (2006b) “(The LSBHs) which extends across the entire object and beyond the edge of the radio lobes shows no apparent association with radio structures.” Villar-Martin et al. (2002)
Massive galaxy and cluster formation/feedback MRC 0052-241, Venemans et al., 2007 Rawlings and Jarvis, 2004
HzRG Lyman background • van Ojik et al. (1997) find spatially resolved line profile structure in 11/18 HzRGs • Villar-Martin et al. (2003) find LSBHs in 10/10 HzRGs + at least 4 more known • Similarly, 5 quasars (Christensen et al. (2006),Weidinger et al. (2004)) show extended emission • Unknown relation, if any, to LABs
Existing B2 0902+34 data Exciting new spectral feature • Inclination of northern radio jet is >30˚ and <45˚ (Carilli 1995) • 21 cm HI absorption at z=3.3968 with FWHM=120 km/s and N=3x1021 cm-2 (Uson et al. 1991 and others) • Normal line ratios for pure AGN photoionization in Ly-a, CIVl1549, and HeIIl1640 (Villar-Martín et al. 2007) Reuland et al. 2007
Existing B2 0902+34 data Reuland et al., 2003
VIRUS-P instrument • Large fibers with 2.7m focal reducer: 4.2” diameter • 105x105arcsec2 field, fill factor 1/3, 247 fibers • 3500-5800Å, R~1000
No resampling in reductions • Does not introduce correlated noise • Allows sky subtraction free of any features and reaches noise limits Bspline, similar to Kelson (2003) Liner interpolation
Our VIRUS-P data a b c Radio data from Carilli 1995
Our VIRUS-P data Primary emission: 5339.0 ± 2.0 Å 600 ± 90 km/s FWHM Secondary emission: 15% as strong 5324.5 ± 1.7 Å 630 ± 270 km/s FWHM
Failing explanations for B2… Q1205-30, Weidinger et al., 2004 • Optically Thin Infall • No bimodal line profile allowed • Too small FWHMs MRC 1558-003, Villar-Martin et al., 2007
Failing explanations for B2… • Outflow (Reuland et al. 2007) • Where is the 21cm HI population in Ly-a? • Why is there no line profile bimodality in the NE? Wilman et al., 2005
Our model: resonant scattering • Monte Carlo Resonant Scattering code with 7x10⁵ photons per simulation • Biconal emission geometry per the Alignment Effect (McCarthy 1993) • Isothermal NFW profile, baseline simulation uses 6x10¹² Ms halo with rv=134 kpc and ri=97 kpc
Model Geometry Tunable parameters: 1) total halo mass 2) ionization radius 3)velocity strength 4)velocity power law with radius
Monte Carlo radiative transfer • Pick a random optical depth from exponential deviate in random direction • Transform to scattering particle’s rest frame • Obtain scatterer’s parallel velocity from the following pdf: • Obtain scatterer’s Maxwellian perpendicular velocity • Obtain scattering direction from dipole distribution • Transform back to observer’s frame • Repeat
Resonant scatter trends Near Cone Far Cone Blue Red
Resonant scatter trends Near Cone Far Cone Blue Red
Resonant scatter trends Near Cone Far Cone Blue Red
Our VIRUS-P data + model a b c Radio data from Carilli 1995
Conclusions • A resonant scatter model explains • The spatial distributions of the bimodal profile • The relative intensities of the bimodal profile • The relative wavelengths of the bimodal profile • The surface brightness profile • The 21cm data • We predict a very large HI mass, 1011-1012Ms • VLBI radio spectral imaging can falsify our model • Are B2 0902+34 and other HzRGs displaying • Strong AGN feedback (outflow) or • Large (cluster?) galaxy formation (infall)
A trial system: B2 0902+34 • Carilli (1995) derives a low inclination angle for the radio jets • Hot spot A is bright and polarized • High projection explains steep spectral index in north • High projection explains lack of alignment effect
Infall or Outflow Wilman et al. (2005) Dijkstra et al. (2006b)
General Resonant Scatter Results • “Dip” Due To Doppler To Line Center Against A Velocity In Neutral Hydrogen • Velocity Magnitude May Come From Red Bump Position/Relative Magnitude • Velocity Shape May Come From Wavelength Dependent Surface Brightness Profile Dijkstra et al. (2006a)
Existing B2 0902+34 data • Undetected in CO(4-3) and CO(5-4), along with 13 other HzRGs (van Ojik et al., 1997) and in CO(4-3), CO(5-4), and CO(8-7) in Evans et al., 1996 • Spitzer data (Seymour et al., 2007) gives fstel=0.28 and Mstel=1010.81Ms
Code Tests Emergent Spectra From Static Sphere Redistribution Function with Dipole Phase Function