Download
1 / 21
210 likes | 317 Vues
Explore hierarchies of units, non-traditional sampling methods, and valuable insights for qualitative inquiries in research studies. Learn the importance of recognizing various levels of information and establish sound sampling schemes. Understand the significance of in-depth investigations with a few units, appreciate a range of non-traditional sampling approaches, and apply hierarchical disposition for optimal resource allocation and sample selection.

E N D
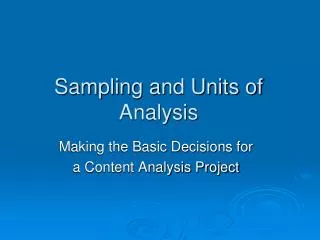
Hierarchies of Units and non-traditional sampling approaches (Session 18)
Learning Objectives By the end of this session, you will be able to • explain the importance of recognising hierarchies of units and the need to consider sampling effort at the different stages • understand the need for in-depth studies with a few units for qualitative enquiries • appreciate a wide range of non-traditional sampling approaches that may be used in the overall sampling scheme
Hierarchies of units • Information exists at various levels & these need to be acknowledged, analysed and used in the sampling scheme, e.g. farming household, village, parish, sub-county, county, district, Uganda. • For example, for research in one district, • Sub-county = primary unit • Parish = secondary unit • farming household = ultimate sampling unit. • Often referred to as “multi-stage” sampling, but this suggests successive time points – we prefer “hierarchical”
Disposition of resources Consider for example Mukono district in Uganda • It has 17 sub-counties • How should sub-counties be sampled? • In each selected sub-county should sampling be • 2 parishes x 20 h/holds in each? • 8 parishes x 5 h/holds each? • Can results be generalised to the district with the scheme adopted? • Use 8, to predict and confirm makes more sense!
Sampling up hierarchies • Top level units “well known”, characterised in many ways. Total number of units is likely to be small. • “Random” sampling often meaningless, as likely to be unrepresentative in face of large amounts of information about units (&/or politically unacceptable) • Units at top level are often chosen purposively using knowledge about these units (see slide 11 for an example)
Sampling down hierarchies • Ultimate units need to be anonymous to research users who need assurance of purposeful, well-defined, objective selection. • Must avoid selections based on vaguely-defined variables that make respondent selections different in each location. • There is a need to incorporate an element of random sampling at some stage, at least at the final level of sampling.
Objectives in hierarchies • Need to think about sample size and information use (e.g. reporting and uptake) at each level of hierarchy. • Need to ensure sample selection is related closely to research objectives and in turn to the recommendation domain for which results are intended.
Numericalness of objectives • Main objective in statistical sampling texts is accurate numerical estimation: not usually the aim in many studies having qualitative aims! • In on-farm studies, do not expect new technologies to apply equally well to all farmers • Which technologies are most effective for which types of farmers is likely to be an important objective. • Estimation of numerical quantities less relevant here, so use common-sense based approaches
Comparison as objective • Rather than quantitative estimation [or a qualitative description], we often want to compare groups, with each other – implies different priorities as to representativeness… • Population 80:20 split implies estimation best based on 80:20 sample split BUT comparison best based on 50:50 sample split so both things compared are equally well understood.
Many comparisons Example : • some areas have good, some bad transport; • some have good environmental conditions, some have bad conditions; • some have, some have not started a District Poverty Initiative Programme. Does study cover all combinations??
Combining or splitting studies • Combine a short questionnaire-style study with more intensive qualitative and/or experimental follow-up • Sampling in the 1st phase may help determine samples for choice of 2nd phase sites –“Table top” sampling plan – as shown in next slide
People sampled within each of a number of communities Subsample for deeper research
Succession of studies • If we can have a succession of studies linked by sampling scheme, ‘read-through’ may be useful, if respondent burden permits • The next slide gives a graphical illustration
Vertical links = in-depth studiesHorizontal at top = main survey studyHorizontals below = sectoral studies
Segmenting a study • Core items done with all respondents, others modularised and done with separate sub-samples – reduces respondent burden • Or studies separately undertaken but linked by common core items
Main and sub-theme coverageof segmented study All sections of respondent sample
Targeting special groups • e.g. how do we sample the poor? Screening methods OK for target groups common in population • Snowball sampling explores rarer, mutually-aware, subgroups • Adaptive sampling - adjust effort where more are found – theory not well developed, currently mainly suits immobile populations.
Replicated sampling • Entire structure of study repeated in miniature, n times • In quantitative studies, can incorporate any number of complications (same ones in each replicate) then treat overall summaries from the replications like a random sample • Analogy could work for qualitative research which seeks reproducibility / generalisability
References • SSC (2000) Some Basic Ideas of Sampling. Statistical Guidelines Series supporting DFID Natural Resources Projects, Statistical Services Centre, The University of Reading, UK. Available at www.reading.ac.uk/ssc/publications/guides.html • Wilson, I.M. (2005) Some Practical Sampling Procedures for Development Research, pp. 37-51 in Holland, J.D. and Campbell, J. (editors) (2005) Methods in Development Research ; Combining Qualitative and Quantitative Approaches, ITDG Publishing. ISBN 1 85339 572 2 • Wilson, I.M. and E.F. Allan (2004) Sampling Concepts In: Stern, R.D., Coe, R., Allan, E. and Dale, I.C.(ed.s) Statistical Good Practice for Natural Resources Research. CAB International, Wallingford, U.K. pp.65 – 86