Sales Analysis Example
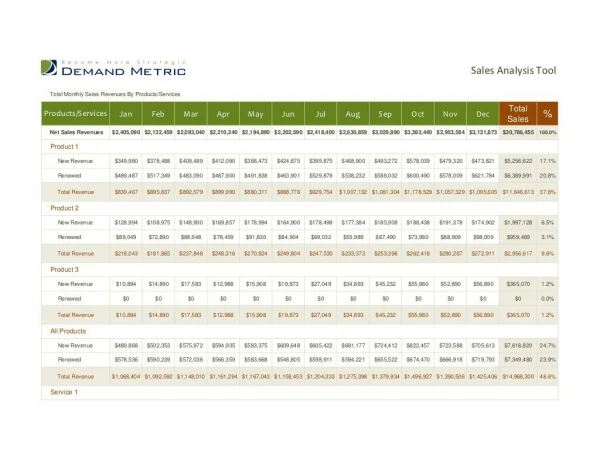
Analyzing sales data, growth rates, costs, and profitability across five districts to optimize strategic decision-making and enhance performance. Comparing productivity and contributions for effective sales management.

Sales Analysis Example
E N D
Presentation Transcript
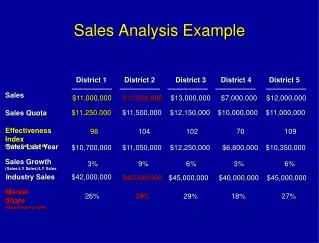
Sales Analysis Example District 1 District 2 District 3 District 4 District 5 Sales $11,000,000 $12,000,000 $13,000,000 $7,000,000 $12,000,000 $11,250,000 $11,500,000 $12,150,000 $10,000,000 $11,000,000 Sales Quota Effectiveness Index (Sales / Sales Quota) 98 104 102 70 109 Sales Last Year $10,700,000 $11,050,000 $12,250,000 $10,350,000 $6,800,000 Sales Growth (Sales-LY Sales)/LY Sales 3% 9% 6% 3% 6% Industry Sales $42,000,000 $42,000,000 $45,000,000 $40,000,000 $45,000,000 Market Share Sales/Industry Sales 27% 26% 29% 29% 18%
District 1 District 2 District 3 Contribution Approach Sales $180,000,000 $70,000,000 $50,000,000 Cost of Goods Sold $168,500,000 $58,500,000 $28,000,000 Gross Margin $ 11,500,000 $11,500,000 $22,000,000 District Selling Expenses $ 5,000,000 $ 3,500,000 $ 2,500,000 Regional Direct Selling Expenses --- --- --- Profit Contribution $ 6,500,000 $ 8,000,000 $19,500,000 Allocated Portion of Shared Zone Costs** Net Profit Profitability Analysis Example Full Cost Approach Region $300,000,000 $255,000,000 $ 45,000,000 $ 11,000,000 $ 10,000,000 $ 24,000,000 $ 16,000,000 Note: District Costs Total To Regional Costs $ 8,000,000 * Regional Direct Selling Expenses are expenses from the Regional Direct Sales Effort. **Allocated shared zone costs are fixed and variable costs due to having an office and managing and administering the district salespeople. ``
Sales Cost of Goods Sold Gross Margin District Selling Expenses Accounts Receivable Inventory Total Assets Managed Profit Contribution Percentage ROAM = (Profit contribution / Sales) X (Sales / Assets managed) Asset Turnover ROAM Return on Assets Managed (ROAM) District 1 District 2 District 3 District 4 $24,000,000 $24,000,000 $24,000,000 $24,000,000 12,000,000 12,000,000 14,000,000 14,000,000 12,000,000 12,000,000 10,000,000 10,000,000 7,200,000 9,600,000 5,200,000 8,800,000 Profit Contribution 4,800,000 2,400,000 4,800,000 1,200,000 4,000,000 8,000,000 4,000,000 16,000,000 4,000,000 8,000,000 4,000,000 16,000,000 8,000,000 16,000,000 8,000,000 32,000,000 5% 20% 10% 20% 3.0 1.5 3.0 .75 15% 30% 30% 15%
Productivity Analysis Example District 1 District 2 District 3 District 4 Sales $20,000,000 $24,000,000 $20,000,000 $24,000,000 Selling Expenses 2,000,000 2,400,000 3,000,000 3,000,000 Sales Calls 9,000 7,500 8,500 10,000 Proposals 200 180 260 270 Number of Salespeople 20 30 20 30 $ 800,000 Sales/Salesperson $ 1,000,000 $ 800,000 $1,000,000 $ 100,000 Expenses/Salesperson $ 100,000 $ 80,000 $ 150,000 333 Calls/Salesperson 450 250 425 9 Proposals/Salesperson 11 6 13