Download
1 / 15
150 likes | 285 Vues
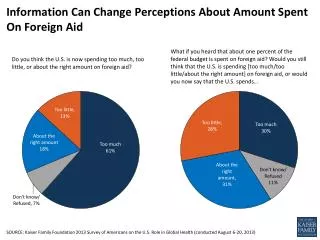
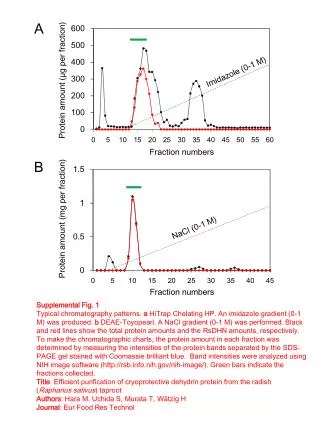
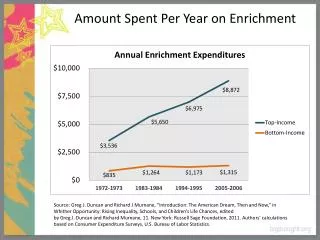
Amount Spent Per Year on Enrichment. Source: Greg J. Duncan and Richard J Murnane , “Introduction: The American Dream, Then and Now,” in Whither Opportunity: Rising Inequality, Schools, and Children’s Life Chances, edited

E N D
Amount Spent Per Year on Enrichment Source: Greg J. Duncan and Richard J Murnane, “Introduction: The American Dream, Then and Now,” in Whither Opportunity: Rising Inequality, Schools, and Children’s Life Chances, edited by Greg J. Duncan and Richard Murnane, 11. New York: Russell Sage Foundation, 2011. Authors’ calculations based on Consumer Expenditure Surveys, U.S. Bureau of Labor Statistics.
More Funding for Some “Communities where student poverty is rare tend to have well-funded schools, whereas schools in communities where student poverty is rampant tend to receive much less funding.” A Research Synthesis / Unequal School Funding in the United States Bruce J. Biddle and David C. Berliner
Triple Inequality Out-of-School Resources In-School Resources Money
What is the Opportunity Gap in Learning Outside the Classroom ? • Thousands of low-income students experience • Inconsistent access to educational supports • Programs that are punitive • Curriculum that doesn’t differ from their school day learning • Few opportunities to pursue their passions • Little family-oriented experiences • Little literacy-oriented experiences How do we provide afterschool and summer learning opportunities that are high-quality, replicable and scalable?
BIG Idea Big Thought’s mission is to make imagination a part of everyday learning. We innovate education to draw students in to learning, thereby helping them succeed
What is So Exciting About Out of School Time? “This is the closest it gets to real teaching, to real school.” -Thriving Minds Summer Instructor Focus Parental Involvement School Culture Pacing Curriculum Staffing
What Does Creativity Look Like? A Student in West Dallas learns of the achievements of Latino architect Santiago Calatrava A student learning a new dance works with a teaching artist … Community Focused Who explicitly connects fractions to whole turns and quarter steps Creative activities tie-in to school day curriculum and are observed for quality Integrated and Active/Hands-On Rigorous
What Does Engagement Look Like? • I want to use it later • It will benefit me in my career/life • It makes sense to me • I’m making something • I’m meeting new people • I’m seeing places I’ve never seen • Improved academics • Improved Developmental Assets • Increased chance of staying in school
Thriving Minds Success Percentage of High-Impact Learning* Occurring in Thriving Minds 2007-2011 *Research conducted in partnership with Dallas ISD Evaluation and Accountability and WolfBrown, using a rubric based on the Principles of Learning developed by the Institute for Learning, the National Standards for Arts Education, and the Framework for 21st Century Learning, developed by the Partnership for 21st Century Learning Skills. www.creatingquality.org
Thriving Minds Afterschool Student Progress Thriving Minds Afterschool TAKS Reading Passing Rates 2008-2011 Thriving Minds Afterschool TAKS Math Passing Rates 2008-2011 T= Terms, which includes fall, spring and summer, taken from 2008-2011. 1400 Thriving Minds students participated in the study. Thriving Minds Summer TAKS Score Improvements 2010-2011 Math Score 2010 Math Score 2011 Reading Score 2010 Reading Score 2011
What Does Collaboration Look Like?Thriving Minds Summer • 6,000 elementary students and 1,350 middle school students served at more than 13 Dallas locations • 1,000 elementary and middle school students served in 10 cultural centers and community sites • 58 juveniles on probation received and eight-week theater and fine arts residency • 1,400 rising third graders studied by researchers to determine how Dallas Children are faring against summer learning loss • 900 educators, including 250 artists and nonprofit staff, instructed Dallas kids • 175 hours of professional development provided for instructors
Who Paid For What: Thriving Minds Summer Camps • Dallas ISD • Types of Funds • General Operating Funds • Temporary ESL (TESL) • Texas Department of Agriculture • Texas Education Agency • Title One • Title Two • Covers: • Classroom teachers • School administration • Custodial Services • Facilities • Transportation • General Supplies • The City of Dallas • Types of Funds • General Operating Funds • Office of Cultural Affairs • Covers: • Cultural Facilities • Community Instructors • Private Funds • Types of Funds • Local, State and National Foundations • Local, State and National Public Funds • Local Private Funders • Covers: • Specialized Instructors • Mission-oriented work • Value-add components • Innovative projects