Download
1 / 24
260 likes | 395 Vues
Lecture 1 Review of Biostatistics. Dr. Obaidur Rahman. Statistical Model. Assume actually exist: Behaviour of - interest rates in the economic market - udergraduates at the end-of-exam party. ‘Real-world’ phenomenon . How to explain this phenomenon?

E N D
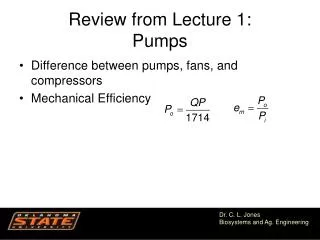
Lecture 1Review of Biostatistics Dr. ObaidurRahman
Statistical Model Assume actually exist: Behaviour of -interest rates in the economic market -udergraduates at the end-of-exam party ‘Real-world’ phenomenon How to explain this phenomenon? Collect available data from the real data Analyze Building a statistical model
Statistical Model Unlike engineers we don’t have access to the real-world situation and so we can only ever infer things about psychological, societal or economic process based upon the model we build. If our inferences to be accurate then the statistical model we build must represent the data collected (the observed data) as closely as possible. The degree to which a statistical model represents the data collected is known as the fit of the model.
Population and Samples • Population mean the entire things • A population can be very general: • all human beings • very narrow: all man in Dhaka named ‘Mofiz’ • Scientists or researchers cannot collect data from every human being, therefore collect a small subset of the population known as a sample. • And use these data to infer things about the population as a whole.
Population and Samples • Small scale model thoughts come for full scale model • Larger the small scale model more likely it will behave like full scale model. • Larger the sample size better the model of the population
Simple statistical models • Mean Five statistics lectures and measured the number of friends: 1,2,3,3 and 4 Mean = (1+2+3+3+4)/5= 2.6 (hypothetical value) Mean is model created to summarized our data.
Simple statistical models Lines represent the deviance between the observed data and our model
Simple statistical models SS is a good measure of the accuracy of our model. But more the data higher the SS.
Frequency Distribution Once we collected some data a very useful thing to do is to plot a graph of how many times each score occurs. This is known as a frequency distribution, or histograms. This is smiply a graph plotting values of observations on the horizontal axis, with bar showing how many times each values occurred in the data sets. Mode can be immediately observed from the graph
Frequency Distribution Frequency distribution come in many different shapes and sizes In an ideal world our data would be distributed symmetrically around the centre of all scores. This is known as a normal distribution. Characterized by bell-shaped curve .
Properties of Frequency Distribution • There are two main ways in which a distribution can deviate from normal: • Lack of symmetry called skewness • pointyness called kurtosis
Standard normal distribution Suicides at Beachy Head in different year by different people: There were total 171 suicides in total How likely is it that 70 year commited suicide at Beachy Head? How likely for 30 years old? 32 out of 171, very likely
Standard normal distribution So the rise of probability comes. What is the probability of a suicide victim being aged 16-20? Probability range from 0 to 1 Or 0 to 100% chance
Probability and standard normal Distribution Statistician worked with several common distribution and calculate the probability of getting particular scores based on the common shapes. One of the shapes is standard normal distribution: mean of 0 and SD is One But all observation doesn’t have this value? Might have mean of 567 and SD of 52.98! So how to calculate these data probability distribution?
Z- table The first important value in z is 1.96 because this cut 2.5% of the distribution and its counterpart at the opposite end (-1.96) cuts of the bottom 2.5% of the distribution. Both the value cut total 5%. Or put another way, 95% of z-scores lie between -1.96 and 1.96. The other important values in z is +2.58 and +3.29 corresponding 99% and 99.9%.