Download
1 / 47
520 likes | 961 Vues
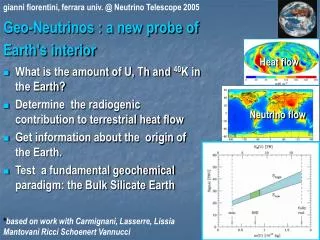
Earthquakes and Earth ’ s Interior. Outline: Seismic Waves Earth Structure First Motions. Seismic Waves. We ’ ve all felt seismic waves from an earthquake, but to understand the phenomenon it must be measured.

E N D
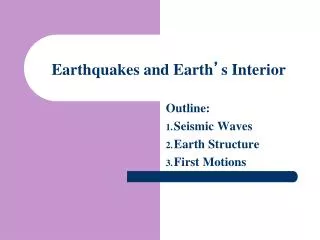
Earthquakes and Earth’s Interior Outline: Seismic Waves Earth Structure First Motions
Seismic Waves • We’ve all felt seismic waves from an earthquake, but to understand the phenomenon it must be measured. • Measurements are made from seismometers distributed throughout the world and with varying sensitivities. • Seismometer physics is based on inertia (resistance to change in position). • Today’s seismometers use the principle of electromotive force (Faraday and Henry). A coil of wire moving through a magnetic field generates a current. • Ideally, we’d measure the displacement of the earth’s surface without being attached to it (more on this new cutting edge stuff at the end of lecture).
In this sketch, the hand is the ground surface and the weight is the seismometer.
The weight stays still, everything else moves. Three inertial seismometers are commonly used in one instrument housing to measure up-down, east-west, north-south motions simultaneously.
The measurements on the three component seismometers look like this: We’ll come back to these in a bit. Movie 1: How Seismo-graph Works
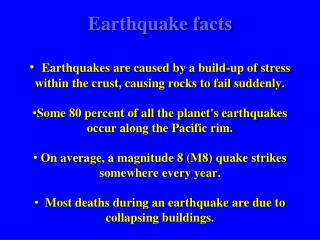
Nomenclature: evil but necessary • The earthquake focus is the point where earthquake starts to release the elastic strain of surrounding rock. • The epicenter is the point on Earth’s surface that lies vertically above the focus of an earthquake. • Fault slippage begins at the focus and spreads across a fault surface in a rupture front. • The rupture front travels at roughly 3 kilometers per second for earthquakes in the crust.
Epicenter Seismic waves radiating outward Focus Rupture front Movie 2: Propagation of Rupture Zone (http://www.tectonics.caltech.edu)
So, what are seismic waves? • Very much like sound waves • There are two basic families of seismic waves. • Body waves can transmit either: • Compressional motion (P waves), or • Shear motion (S waves). • Surface waves are vibrations that are trapped near Earth’s surface. There are two types of surface waves: • Love waves, or • Rayleigh waves. • Read about these in your book.
Body Waves • Body waves travel outward in all directions from their point of origin. They are 3D. • The first kind of body waves, a compressional wave, deforms rocks largely by change of volume and consists of alternating pulses of contraction and expansion acting in the direction of wave travel. • Compressional waves are the first waves to be recorded by a seismometer, so they are called P (for “primary”) waves. • The second kind of body waves is a shear wave. • Shear waves deform materials by change of shape, • Because shear waves are slower than P waves and reach a seismometer some time after P waves arrives, they are called S (for “secondary”) waves.
P=Primary Follow the volume change by reading clockwise from upper left. The volumes are deformed by expansion and contraction.
Movie 3: Seismic Wave Motion (a) Movie 4: Seismic Wave Motion (b) S=Secondary The volumes are deformed by shifting one face relative to the other.
P-wave (From: Marshak, 2004) S-wave
Rayleigh wave (vertical) Love wave (horizontal)
Rayleigh waves cause the ground to undulate in a rolling motion, like waves on the sea surface, while Love waves cause the ground to undulate laterally (From: Marshak, 2004)
Body Waves • Compressional (P) waves can pass through solids, liquid, or gases. • P waves move more rapidly than other seismic waves: • 6 km/s is typical for the crust. • 8 km/s is typical for the uppermost mantle. • Shear (S) waves consist of an alternating series of side-wise movements. • Shear waves can travel only within solid matter. • A typical speed for a shear wave in the crust is 3.5 km/s, 5 km/s in the uppermost mantle. • Seismic body waves, like light waves and sound waves, can be reflected and refracted by change in material properties. • When change in material properties results in a change in wave speed, refraction bends the direction of wave travel.
How do we know these velocities and travel paths? (From: Marshak, 2004)
(From: Murck and Skinner, 1999) Wave refraction as seismic waves cross a boundary between rocks with differing physical properties
This could be the initial P phase This could be PcP phase Typically, V2 > V1 because pressure increases with depth, which causes an increase in density and rigidity. This could be PKP phase Applies to sound and light waves, too
Earthquakes and Earth’s Interior Outline: Seismic Waves Earth Structure First Motions
So, with these basic laws of physics, the earth could look like this: To test this theory, we need a distribution of seismometers measuring seismic waves from an earthquake. Next, lets look at various seismograms to see what is measured. b/c this is upward P Should be pP
First, the earthquake needs to be located. • Initially, we don’t know the exact time of an earthquake, rather we only know the times of the arrivals at the seismometer of the various seismic waves. • So, an earthquake’s epicenter can be calculated from the arrival times of the P and S waves at a seismometer. • The farther a seismometer is away from an epicenter, the greater the time difference between the arrival of the P and S waves because P wave velocities > S wave velocities. • The epicenter can be determined when data from three or more seismometers are available. • It lies where the circles intersect (radius = calculated distance to the epicenter, see next two slides). • The depth of an earthquake focus below an epicenter can also be determined, using P-S time intervals (more later), or by Pp – P travel time differences.
Vs = 0.6Vp the time interval between the arrival of P- and S- waves increases with distance from the earthquake
Different travel times allow epicenter to be determined from three seismograph stations (From: Marshak, 2004)
Time since the Earthquake Distance from Earthquake Suppose we get lucky and we know the location of the earthquake – e.g., someone living in California knows the location. Then, say there’s a collection of seismometers located in Denver, St. Louis, and Columbus, i.e., the distance from CA to CO to MO to OH is known. The seismograms for those three locations may resemble the plot on the left. Now, suppose an earthquake occurs in Turkey and seismometers are located in Italy, France, and the UK. The resulting travel time curves look the same. So, the earth must have a generally uniform structure. Movie 5: Seismic Wave Travel Time (a) Movie 6: Seismic Wave Travel Time (b) http://www.iris.edu
Lithosphere Svel ~ 3.5 to 5 km/s Lithosphere Pvel ~ 6 to 8 km/s This chart is an abbreviated version of the Jeffreys-Bullen travel time charts. Posters around Mendenhall have more detail, but not the complete JB charts. The JB travel time charts also show P and pP arrivals, so depths can be approximated using a travel-time method similar to the epicenter locating method.
Fig. 8.13c W. W. Norton
JB travel time chart Why do the S and P phases stop just past 100 degrees on the travel-time chart? This is the model This is Observed figure not in text book
Some Animations • Movie 7: Seismic Ray Paths and Shadow Zone • The shadow zone is the area of the earth from angular distances of 104 to 140 degrees that, for a given earthquake, does not receive any direct P waves. The shadow zone results from S waves (not shown in animation) being stopped entirely by the liquid core and P waves being bent (refracted) by the liquid core. • Movie 8: Seismic Wavefronts • The wavefront is the instantaneous boundary between the seismic waves in the earth material, and the material that the seismic energy has not yet reached. http://earthquake.usgs.gov/learn/animations/
Given a location, velocity can be calculated • Direct P or S wave arrivals have a velocity of distance/time. • But, must account for expected increases in velocity with depth and a wave that travels through the earth, not the distance we plotted in the travel time chart. • P is an example of a direct arrival whereas PcP phase is an example of a phase reflected from the outer core mantle boundary, we’ll quickly calculate their velocities next.
JB travel time chart Calculations: 40 degrees from the focus, the direct P wave arrives at about 7.5 minutes. Average velocity is (40 degrees * 111 km/deg)/(7.5 min * 60 sec/min) = 9.9 km/s. This is not a lithospheric velocity. Say we use this 9.9 km/s to calculate the depth to the CMB. PcP at 0 degrees arrives at about 8.25 minutes. (8.25 min * 60 s/min * 9.9 km/s)/2 = 2450 km. The CMB is actually around 2900 km, so the average P wave velocity to 2900 km is (2900 km)/(8.25 min * 60 s/min)*2 = 11.7 km/s. Questions: why divide by 2 and multiply by 2? Why use 0 degrees distance for PcP calculations? Next: we’ll compare these to more robust model based velocity calculations.
Model Derived P and S Wave Velocities We quickly calculated an average P wave velocity of 11.7 km/s to the CMB, how does that compare to this model? Answer: it looks about right. We also quickly calculated and average mantle P wave velocity of 9.9 km/s, how does that compare to this model? Answer: it looks a about right for upper mantle, but too slow for all of the mantle. Say the ray path samples the lower mantle, then we conclude that the path went through some hotter, less rigid material (compared to the surrounding). That’s the basics of seismic tomography (next slide).
Int.-C.10a From Su, W.J., and Dziewonski, A.M., 1994. This image was produced by X. Song.
Cold slab subducting beneath us! P wave velocities S wave velocities
Review of Previous Material • Studying the Earth’s interior using seismic • waves • Seismic waves travel in all directions • Wave velocity increases with depth curved pathways • Wave speed depends on properties of material • S-waves cannot be transmitted through liquids (i.e. the core) • Refraction occurs where waves cross a boundary between rocks with different physical properties • Seismic tomography can be used to probe the Earth’s interior (similar to X-rays or CAT-scans)
Earth’s internal structure (From: Murck and Skinner, 1999)
P-wave refraction and S-wave shadow zone (From: Murck and Skinner, 1999)
Earth’s layered structure • different layers can be identified • boundaries may separate layers with different composition, or separate layers with the same composition but differing physical properties • Moho: boundary between crust and mantle separates layers with differing composition • Asthenosphere: composition similar to layers above and below, but rocks are close to melting and have little strength differing physical properties
Earthquakes and Earth’s Interior Outline: Seismic Waves Earth Structure First Motions
First-Motion Studies (moment tensor solution) Of The Earthquake Source • If the first motion of the arriving P wave pushes the seismometer upward, then fault motion at the earthquake focus is toward the seismometer. • If the first motion of the P wave is downward, the fault motion must be away from the seismometer. • S-waves and surface waves also carry the signature of earthquake slip and fault orientation and can provide independent estimates of motion at the earthquake focus.
Why are there 4 quadrants? Answer: Imagine you are a StrkSlp EQ Toward you Away from you Its not easy to pick these first motions on real seismograms!
N N45E N45W 180º 90º 5º E W eq S45E S45W S How to make a focal mechanism plot (beach ball plot) Down, pull dilation Up, push compression Say, an EQ happened in California and we recorded here at OSU. WRT CA, we are are mostly East and just a little North and we’re about 40º away. Say, the first P-wave motion we recorded was an “up”. So, we’d plot the black dot. Imagine filling the graph with up and down motions from seismometers around the globe. We’d end up with plots looking like beachballs. Up, push compression Down, pull dilation Normal Faulting Look straight down on this drawing and you see the beach ball. ap fp Now, why do explosions differ from earthquakes? Answer: explosions create compressional P-wave up motions in all quadrants.
Low Angle Thrust Fault Up, push compression Down, pull dilation Down, pull dilation Up, push compression From the fault plane solutions, either the left or right sketches are correct. Note the difference in fault dip.
figure not in book California Earthquakes California has all types of EQs, but mostly strike slip. Which EQs are right lateral, which are left lateral, which are normal, dipping west, etc… Which way would you conclude is the major stress orientation?
Seismic stations around the world are used to measure and model the Japan 2011 earth-quake. Note that all 4 quadrants around the epicenter are covered with stations. http://www.geol.tsukuba.ac.jp/~yagi-y/EQ/Tohoku/
Models and Observations • Seismic station recordings are in black and model seismic waveforms are in red. The match gives confidence that the model represents reality. Note how first arrivals differ; compare upper left plots to those in the middle. http://www.geol.tsukuba.ac.jp/~yagi-y/EQ/Tohoku/
Focal Mechanism for Japan 2011 Earthquake http://www.geol.tsukuba.ac.jp/~yagi-y/EQ/Tohoku/
Answer These Questions • If the Earth had no core, what would the seismic wave travel times look like (assume that if the core is missing, the resulting hole is filled with mantle material)? • How would a collection of explosions differ from a collection of earthquakes? • What type of seismic waves cause destruction? Why do these waves only cause destruction near the earthquake and not further away?