Download
1 / 3
30 likes | 140 Vues
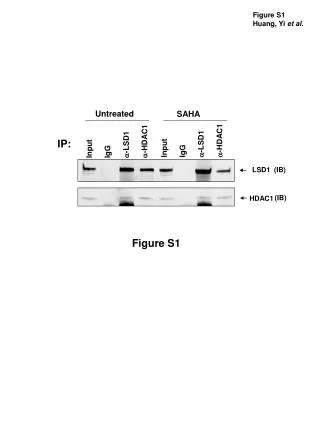
This study investigates the gene expression changes triggered by the combined treatment with SAHA (suberoylanilide hydroxamic acid) and pargyline in untreated cells. Using immunoprecipitation (IP) and immunoblotting (IB) techniques, we analyzed the interactions of LSD1 and HDAC1 in the presence of various SAHA concentrations (0, 1 mM, 5 mM, and 10 mM). The functional classification of genes with significant expression changes, identified using DAVID Bioinformatics Resources, reveals those with a change greater than or equal to 1.5-fold, highlighting the biological impact of this combination therapy.

E N D
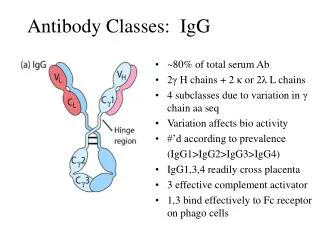
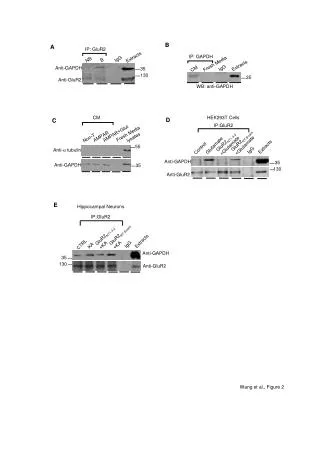
Figure S1 Huang, Yi et al. Input IgG a-LSD1 a-HDAC1 Input IgG a-LSD1 a-HDAC1 Untreated SAHA IP: (IB) LSD1 (IB) HDAC1 Figure S1
Figure S2 Huang, Yi et al. Untreated 1 mM 5 mM 10 mM H2O A SAHA LSD1 Actin Untreated 1 mM 5 mM 10 mM B SAHA LSD1 Actin Figure S2
Table S1 Huang, Yi et al. Table S1. Functional classification of genes whose expression is changed only by combined treatment with SAHA and pargylinea. • The Database for Annotation, Visualization and Integrated Discovery (DAVID) Bioinformatics Resources 6.7 program is used. • Genes functions with enrichment score >1 are shown. • Listed are genes with expression induction or reduction equal or greater than 1.5 fold.