Prices and Equilibrium
140 likes | 281 Vues
This guide explores the role of prices in economic systems, illustrating how supply and demand establish the monetary value of products. Participants are encouraged to engage in discussions about fairness in pricing and the potential role of government regulation. The document covers key concepts such as market equilibrium, surplus, and shortage and provides graphical representations of demand and supply curves. It also examines the effects of price ceilings, price floors, and rationing. Understanding these elements can lead to better economic decision-making for both consumers and producers. ###

Prices and Equilibrium
E N D
Presentation Transcript
Prices and Equilibrium Mr. Bammel
The monetary value of a product as established by supply and demand. • Turn to a partner in the room and have a discussion. Answer the questions: • Are prices fair? • Should the government help dictate prices? • In what situations do you think government should dictate prices? Prices
Prices link the producers and consumers; and allow allocation of goods and services to be smooth and efficient. • Advantages of prices • There is neither a favor in producers, nor consumers • Prices are flexible and allow economy to accommodate change • No Cost in administration • Familiar and easily understood Advantages Prices
What would be done if we did not use price as a means to distribute goods and services? What options exist? Without Price
A system under which an agency such as the government decides everyone’s “fair” share. • People receive Ration Coupons, which is a ticket or a receipt that entitles the holder to obtain a certain amount of a product. • What are all the problems with rationing? Rationing
After reading the information on page 140 about prices as a system, explain in your own words how prices act as a system which tells the market where resources should be allocated. Prices as a System
Take the large piece of paper and fold it in half three separate times to create 8 squares/sections for use of drawing graphs. Graphing Market Demand and Supply Curves
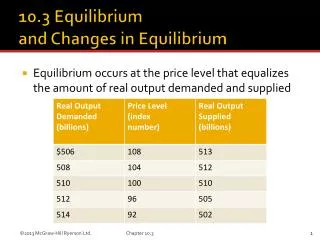
Draw a graph which has price labeled on the Y-axis and Quantity labeled on the X-axis. Then draw an example Demand Curve and an example Supply Curve in the graph. • Use the graph to draw in a point labeled “E” where one would find Market equilibrium. • Explain off to the side what Market equilibrium is and what Price Equilibrium means. Square #1: Market Equilibrium
Draw a graph which has price labeled on the Y-axis and Quantity labeled on the X-axis. Then draw an example Demand Curve and an example Supply Curve in the graph. • Find a price on the graph that would display a surplus of a product. • What is a surplus? • What will tend to happen if a surplus does exist? Square #2: Surplus
Draw a graph which has price labeled on the Y-axis and Quantity labeled on the X-axis. Then draw an example Demand Curve and an example Supply Curve in the graph. • Find a price on the graph that would display a shortage of a product. • What is a shortage? • What will tend to happen if a shortage does exist? Square #3: Shortage
Draw a graph which has price labeled on the Y-axis and Quantity labeled on the X-axis. Then draw an example Demand Curve and an example Supply Curve in the graph. • Use a different color pen/pencil and draw a line representing an increase in Supply. Using the same color pen/pencil, write down what happens to the price and the quantity because of this increase in supply. • Use a different color pen/pencil and draw a line representing an decrease in Supply. Using the same color pen/pencil, write down what happens to the price and the quantity because of this decrease in supply. Square #4: Changes in Supply
Draw a graph which has price labeled on the Y-axis and Quantity labeled on the X-axis. Then draw an example Demand Curve and an example Supply Curve in the graph. • Use a different color pen/pencil and draw a line representing an increase in demand. Using the same color pen/pencil, write down what happens to the price and the quantity because of this increase in demand. • Use a different color pen/pencil and draw a line representing an decrease in demand. Using the same color pen/pencil, write down what happens to the price and the quantity because of this decrease in demand. Square #5: Changes in Demand
Draw a graph which has price labeled on the Y-axis and Quantity labeled on the X-axis. Then draw an example Demand Curve and an example Supply Curve in the graph. • Use the graph to display a Price Ceiling. • Explain what a price ceiling is and what is created by a price ceiling. • Explain the example of Rent Controls and how it must abide by price ceilings. Square #6: Price Ceilings
Draw a graph which has price labeled on the Y-axis and Quantity labeled on the X-axis. Then draw an example Demand Curve and an example Supply Curve in the graph. • Use the Graph to display Price Floors. • Explain what a price floor is and what is created by a price floor. • Explain the example of minimum wage and it must abide by a price floor. Square #7: Price Floors