Download
1 / 5
50 likes | 283 Vues
Sketching the Graph of a Function Using Its 1st and 2nd Derivatives. What does the 1 st derivative of a function tell us about the graph of the function? It tells us __________________________________________________________

E N D
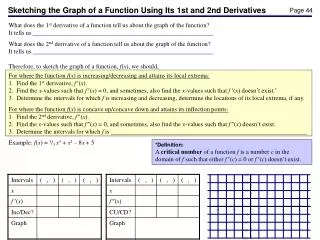
Sketching the Graph of a Function Using Its 1st and 2nd Derivatives • What does the 1st derivative of a function tell us about the graph of the function? • It tells us __________________________________________________________ • What does the 2nd derivative of a function tell us about the graph of the function? • It tells us __________________________________________________________ • Therefore, to sketch the graph of a function, f(x), we should, • For where the function f(x) is increasing/decreasing and attains its local extrema: • Find the 1st derivative, f(x). • Find the x-values such that f(x) = 0, and sometimes, also find the x-values such that f(x) doesn’t exist.* • Determine the intervals for which f is increasing and decreasing, determine the locations of its local extrema, if any. • For where the function f(x) is concave up/concave down and attains its inflection points: • 1. Find the 2nd derivative, f(x). • 2. Find the x-values such that f(x) = 0, and sometimes, also find the x-values such that f(x) doesn’t exist. • 3. Determine the intervals for which f is _______________________________________________________________ Example: f(x) = 1/3 x3 + x2 – 8x + 5 *Definition: A critical number of a function f is a number c in the domain of f such that either f(c) = 0 or f(c) doesn’t exist.
Sketching the Graph of a Function (cont’d) If a function is not a constant function, then it will increase and/or _____________. If it is not a linear function, it will be concave up and/or __________. If so, the graph of the function can only consist of one or more of the following 4 pieces: Inc and CU Dec and ____ ____ and ____ Dec and CD Example: f(x) = x4 – x2 – 2x – 1 (Note: The only critical number from f (x) is x = 1.)
General Techniques/Considerations When Sketching a Function When sketching the graph of a function, f(x), besides considering increasing/decreasing and concavity (i.e., concave up/concave down), we also need to considering following: A. Domain: determine all possible values of x B. Intercepts:y-intercept (by plug __ into f(x)) and x-intercept(s) (by setting f(x) = __ and solve for x)* C. Symmetry: determine whether it is symmetric with respect to (wrt) the ______ or wrt the ______ (see below.) D. Asymptotes: determine whether there is any _______ and/or ______ asymptotes (see below.) * Only when the x-intercepts are manageable to find. Of course, for where f(x) is increasing/decreasing (incl. local extrema) and concavity (incl. inflection points), we have to find the following: E. Intervals of Increase/Decrease: Use the I/D Test: f (x) > 0 increasingand _________ __________ F. Local Maximum/Minimum: Find the x-values where f (x) = 0 orf (x) doesn’t exist. f will likely have local extrema at these x-values (but not a must). G. Concavity and Inflection Points: Use the Concavity Test: f(x) > 0 concave upand ______ _____. Find the x-values where f (x)= 0 orf (x)doesn’t exist. f will likely have inflection points at these x-values (but not a must). When you have all these components, H. Sketch the function. C. Symmetry D. Asymptotes
Sketch a Function Using A-H (from the Previous Page) Ex 1.f(x) = (x2 – 4)/(x2 + 1) A. Domain: B. Intercepts: C. Symmetry: D. Asymptotes: E. Intervals of Increase/Decrease: F. Local Maximum/Minimum: G. Concavity and Inflection Points: H. Sketch the function
Sketch a Function Using A-H Ex 1.f(x) = x/(x2 – 4) A. Domain: B. Intercepts: C. Symmetry: D. Asymptotes: E. Intervals of Increase/Decrease: F. Local Maximum/Minimum: G. Concavity and Inflection Points: H. Sketch the function