Download
1 / 14
160 likes | 445 Vues
Introduction to Upper Air Data. Mandatory and Significant Levels General Vertical Profiles of the Atmosphere Upper Air Maps TTAAs, TTBBs, PPBBs. Mandatory vs. Significant Levels. Mandatory levels are those that will always appear in upper air analysis gathered from radiosonde data

E N D
Introduction to Upper Air Data • Mandatory and Significant Levels • General Vertical Profiles of the Atmosphere • Upper Air Maps • TTAAs, TTBBs, PPBBs
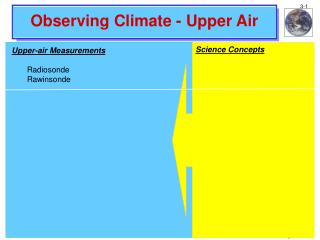
Mandatory vs. Significant Levels • Mandatory levels are those that will always appear in upper air analysis gathered from radiosonde data • Significant levels are levels where there is significant data to present (usually not represented with a map but just incorporated on soundings)
Mandatory Levels and Heights • Surface - obviously • 1000mb - varies on station elevation • 925mb - varies on station elevation • 850mb - ~1500m • 700mb - ~3000m • 500mb - ~5500m • 400mb - ~7000m • 300mb - ~9500m • 250mb - ~11000m • 200mb - ~12000m • 150mb - ~14000m • 100mb - ~16000m
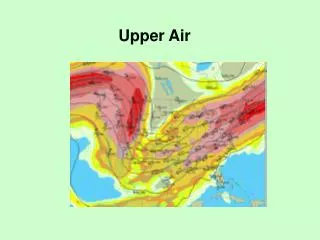
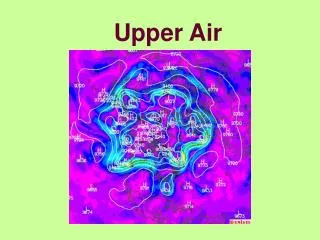
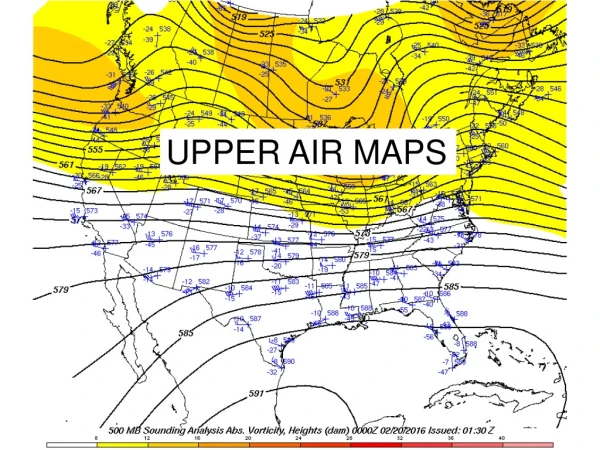
Upper Air Maps • This is why knowing heights is important • Dew point vs. Dew point depression • Normally temperature decreases with height until ~200mb where it becomes isothermal then increases with height in the stratosphere • Wind increasing with height until the jet stream (~250mb) • There are troughs and ridges like sfc maps • http://weather.unisys.com/upper_air/mandatory.html • Details
TTAAs and TTBBs • TTAAs are mandatory level data, temperature, dew point depression, height of p level, wind speed and direction is given • TTBBs are significant level data, temperature, dew point depression, and p level is given • PPBBs are the corresponding wind data with heights of the significant levels
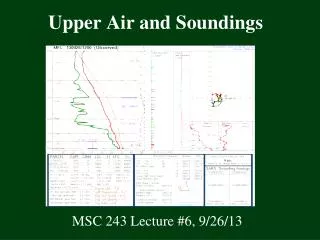
Decoding all that data • See http://www.ems.psu.edu/Courses/Meteo200/lesson5/decode.htm • This link shows how to decode all this data and all the “tricks” • There are little tests on this page to help • All this data is displayed in thermodynamic charts, such as Skew T – Log P diagrams • In this class we’ll focus just on TTAA
850 mb Maps • How to decode station models for this level • Temp plotted upper left in Celsius • Dewpoint DEPRESSION plotted • Circle shaded if T-D is 5 or less • Height plotted in meters without first 1 • Height change over 12 hours given in decameters. • Winds plotted same as surface maps
850 mb Maps • What is the significance of 850 mb maps? • Temperature and moisture advection • Rain/snow detection • Forecast of high and low temperature • Low level jet • Tilting of pressure systems • Height contour intervals are every 30m and isotherms are every 5 degrees
700 mb Maps • Interpretation is the same as 850mb except heights are plotted without the first digit, which is a 2 or 3. • Contour intervals are every 30m and isotherms are every 5 degrees. • Used to find: • Short waves • Advections • Steering flow for storms
500 mb Maps • Contours are every 60 meters • Stations are plotted as on 850 & 700mb maps, but height is given without the last digit, which is a 0. • Used to find areas of vorticity advection.
1000-500 mb Thickness plots • This plot gives the thickness of the layer of the atmosphere between 1000mb and 500mb. • Related to mean temperature of the atmosphere. • Can determine motion of organized convection (Mesoscale convective complexes) • Rain vs. Snow
300/250/200 mb Maps • Contour interval is 120 m, isotachs are every 20 knots • Heights coded just like in TTAA • Used to find jet streams and jet streaks • Useful to find areas of convergence/divergence aloft. • Cyclogenesis can be enhanced • Boundary between cold and warm air
Combining the Upper-Air Maps • So how can using all these maps help us understand the state of the atmosphere. • Atmosphere is 3-D • Can help aid in forecasting development/decay of weather systems • Developing cyclones tilt left as you look higher in the atmosphere • Dying cyclones tend to be stacked or tilt right
Combining the upper air maps • Impacts for air travel? • Jet streams/streaks • Wind speed and direction aloft • Temperatures aloft • Moisture aloft • Next: Plotting and diagnosing data on a Skew-T, stability, severe wx signatures etc.