Download

1 / 19
190 likes | 281 Vues
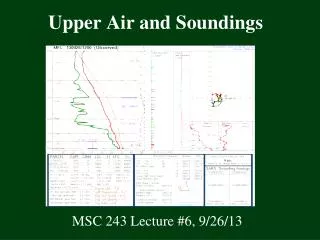
Upper Air Diagrams. The St üve Diagram. One of a number of atmospheric plotting charts. Temperature scale (deg. Celsius). I s o t h e r m s. b) e (m r e u l s a s c e S r P. - - - I s o b a r s - - -. Graph for plotting radiosonde observations.

E N D
The Stüve Diagram One of a number of atmospheric plotting charts
I s o t h e r m s
b) e (m r e u l s a s c e S r P
Graph for plotting radiosonde observations
All process lines Analog computer
Station Sounding Data for TOP (72456) 00Z 14 MAY 2007 LAT = 39.07 LON = -95.62 ELV = 270.0 PRES HGHT TMPC DWPC RELH DRCT SKNT MIXR 985 270 30.6 13.6 35 180 10 10.1 1000 133 0.0 0.0 0 0 0 0.0 981 305 30.3 13.4 36 180 11 10.0 948 610 27.2 11.4 37 190 18 9.0 925 822 25.0 10.0 39 195 18 8.4 915 914 24.2 9.8 40 195 19 8.4 884 1219 21.3 9.0 45 195 19 8.2 850 1555 18.0 8.0 52 190 19 8.0 823 1829 15.5 7.1 57 190 19 7.7 794 2134 12.6 5.9 64 195 18 7.4 765 2438 9.7 4.8 72 200 21 7.1 753 2576 8.4 4.3 75 200 23 7.0 738 2743 8.1 -2.8 46 200 25 4.3 729 2843 7.8 -7.2 34 200 25 3.1 710 3061 8.2 -6.8 34 200 26 3.3 700 3178 7.8 -12.2 23 200 27 2.2 688 3320 7.0 -22.0 11 201 25 1.0 660 3658 4.3 -20.5 14 205 21 1.2 635 3971 1.8 -19.2 19 215 17 1.4 612 4267 0.0 -26.1 12 225 14 0.8 570 4831 -3.5 -39.5 4 257 9 0.3 567 4877 -3.8 -39.6 4 260 9 0.3 500 5850 -11.1 -43.1 5 255 7 0.2 484 6096 -13.2 -43.8 6 265 6 0.2 436 6886 -20.1 -46.1 8 292 10 0.2 400 7520 -25.3 -41.3 21 315 13 0.3
Sounding Data for TOP (72456) 00Z 14 MAY 2007 LAT = 39.07 LON = -95.62 ELV = 270.0 PRES HGHT TMPC DWPC RELH DRCT SKNT MIXR 985 270 30.6 13.6 35 180 10 10.1 1000 133 0.0 0.0 0 0 0 0.0 981 305 30.3 13.4 36 180 11 10.0 948 610 27.2 11.4 37 190 18 9.0 925 822 25.0 10.0 39 195 18 8.4 915 914 24.2 9.8 40 195 19 8.4 884 1219 21.3 9.0 45 195 19 8.2 850 1555 18.0 8.0 52 190 19 8.0 823 1829 15.5 7.1 57 190 19 7.7 794 2134 12.6 5.9 64 195 18 7.4 765 2438 9.7 4.8 72 200 21 7.1 753 2576 8.4 4.3 75 200 23 7.0 738 2743 8.1 -2.8 46 200 25 4.3 729 2843 7.8 -7.2 34 200 25 3.1 710 3061 8.2 -6.8 34 200 26 3.3 700 3178 7.8 -12.2 23 200 27 2.2 688 3320 7.0 -22.0 11 201 25 1.0 660 3658 4.3 -20.5 14 205 21 1.2 635 3971 1.8 -19.2 19 215 17 1.4 612 4267 0.0 -26.1 12 225 14 0.8 570 4831 -3.5 -39.5 4 257 9 0.3 567 4877 -3.8 -39.6 4 260 9 0.3 500 5850 -11.1 -43.1 5 255 7 0.2 484 6096 -13.2 -43.8 6 265 6 0.2 436 6886 -20.1 -46.1 8 292 10 0.2 400 7520 -25.3 -41.3 21 315 13 0.3 Date
Sounding Data for TOP (72456) 00Z 14 MAY 2007 LAT = 39.07 LON = -95.62 ELV = 270.0 PRES HGHT TMPC DWPC RELH DRCT SKNT MIXR 985 270 30.6 13.6 35 180 10 10.1 1000 133 0.0 0.0 0 0 0 0.0 981 305 30.3 13.4 36 180 11 10.0 948 610 27.2 11.4 37 190 18 9.0 925 822 25.0 10.0 39 195 18 8.4 915 914 24.2 9.8 40 195 19 8.4 884 1219 21.3 9.0 45 195 19 8.2 850 1555 18.0 8.0 52 190 19 8.0 823 1829 15.5 7.1 57 190 19 7.7 794 2134 12.6 5.9 64 195 18 7.4 765 2438 9.7 4.8 72 200 21 7.1 753 2576 8.4 4.3 75 200 23 7.0 738 2743 8.1 -2.8 46 200 25 4.3 729 2843 7.8 -7.2 34 200 25 3.1 710 3061 8.2 -6.8 34 200 26 3.3 700 3178 7.8 -12.2 23 200 27 2.2 688 3320 7.0 -22.0 11 201 25 1.0 660 3658 4.3 -20.5 14 205 21 1.2 635 3971 1.8 -19.2 19 215 17 1.4 612 4267 0.0 -26.1 12 225 14 0.8 570 4831 -3.5 -39.5 4 257 9 0.3 567 4877 -3.8 -39.6 4 260 9 0.3 500 5850 -11.1 -43.1 5 255 7 0.2 484 6096 -13.2 -43.8 6 265 6 0.2 436 6886 -20.1 -46.1 8 292 10 0.2 400 7520 -25.3 -41.3 21 315 13 0.3 Lat./Long./Elevation (m MSL)
Sounding Data for TOP (72456) 00Z 14 MAY 2007 LAT = 39.07 LON = -95.62 ELV = 270.0 PRES HGHT TMPC DWPC RELH DRCT SKNT MIXR 985 270 30.6 13.6 35 180 10 10.1 1000 133 0.0 0.0 0 0 0 0.0 981 305 30.3 13.4 36 180 11 10.0 948 610 27.2 11.4 37 190 18 9.0 925 822 25.0 10.0 39 195 18 8.4 915 914 24.2 9.8 40 195 19 8.4 884 1219 21.3 9.0 45 195 19 8.2 850 1555 18.0 8.0 52 190 19 8.0 823 1829 15.5 7.1 57 190 19 7.7 794 2134 12.6 5.9 64 195 18 7.4 765 2438 9.7 4.8 72 200 21 7.1 753 2576 8.4 4.3 75 200 23 7.0 738 2743 8.1 -2.8 46 200 25 4.3 729 2843 7.8 -7.2 34 200 25 3.1 710 3061 8.2 -6.8 34 200 26 3.3 700 3178 7.8 -12.2 23 200 27 2.2 688 3320 7.0 -22.0 11 201 25 1.0 660 3658 4.3 -20.5 14 205 21 1.2 635 3971 1.8 -19.2 19 215 17 1.4 612 4267 0.0 -26.1 12 225 14 0.8 570 4831 -3.5 -39.5 4 257 9 0.3 567 4877 -3.8 -39.6 4 260 9 0.3 500 5850 -11.1 -43.1 5 255 7 0.2 484 6096 -13.2 -43.8 6 265 6 0.2 436 6886 -20.1 -46.1 8 292 10 0.2 400 7520 -25.3 -41.3 21 315 13 0.3 Pressure (mb) Height (m) Temp. (C) Dewpt. (C) Rel. Hum. (%) Wind Dir. (deg) Wind Spd (kts) Mix Ratio (g/kg)