Download

1 / 11
110 likes | 236 Vues
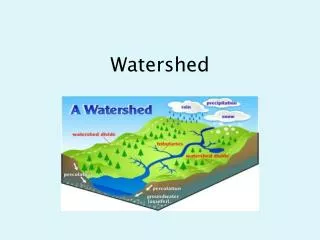
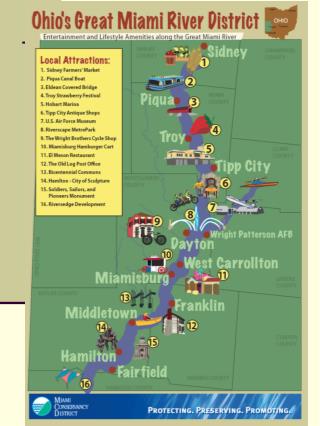
The Great Miami Loramie Watershed. Neelu, Jasmine, and Cassie. Information. Loramie Creek is part of the Great Miami Watershed Primarily located in Shelby County North of Dayton in Southwest Ohio Drains into the Ohio River Length = 40 mi

E N D
The Great Miami Loramie Watershed Neelu, Jasmine, and Cassie
Information • Loramie Creek is part of the Great Miami Watershed • Primarily located in Shelby County • North of Dayton in Southwest Ohio • Drains into the Ohio River • Length = 40 mi • Farming is Ohio’s #1 industry & agricultural land borders most of our stream • Sources of Impairment: Habitat Alterations, Flow Alterations, Nutrient Enrichment, Metals, Siltation, and Ammonia
As the COD increases, the IBI decreases • COD (Chemical Oxygen Demand): Measure of chemical pollution in the water • IBI: fish diversity • Urban growth increases COD levels • Growth in the agricultural and urban areas increases runoff of harmful chemicals from the watershed • COD levels are significantly high in our watershed • High levels of COD can be harmful to the fish, causing the IBI to drop
Increased levels of COD result in decreased IBI • Green arrows represent two areas that would deny my hypothesis • This could be due to other physical indicators, such as substrate, which will be introduced later IBI Scale COD Scale HUCDATE
Background Information • Ammonia: • A specific chemical measure in stream quality • Tested for in watersheds • Used in farming fertilizer, also used in household cleaners • Many agricultural areas use fertilizer • Agricultural areas make up 87% of land around our watershed
Background Information cont. My Hypothesis: As Ammonia levels increase, IBI levels decrease. • More about Ammonia: • Ammonia gets into the watershed via runoff from farm fields • Very toxic to fish
Comparing IBI & Ammonia (NH3) Support: NH3 levels >1 ppm are toxic to fish A few spots with decreased IBI and decreased Ammonia Ammonia Scale IBI Scale HUCDATE • Could be because of other factors in our stream that are both • chemical & physical
Substrate vs. IBI vs. ICI • 3 Indicators are used to measure streams health • *Biological • *Chemical • *Physical • Substrate physical indicator
Why is the Substrate Important?The substrate acts as a breeding ground for the fish and macroinvertebrates that live in the stream • Serves as breeding ground for fish. • Macroinvertebrates at bottom of food chain; acts as food for fish • Because our substrate is of good quality, fish can grow and develop in our stream. The macroinvertebrates live in the substrate and are eaten by fish. • Moderate substrate score of 13.8 on a scale of 0-20 • Good Substrate Scores result in Increased ICI & IBI • Substrate is a habitat for macroinvertebrates
The higher quality the substrate is, the higher IBI and ICI are. HUCDATE
YWSI would like to thank the following sponsors: Thank You!!! Special Thanks to Steve, Paula, & Kristi