Download
1 / 44
450 likes | 588 Vues
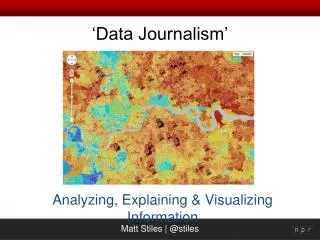
Data journalism: The myths and the magic. ASNE Convention Washington, DC June 25, 2013. Myth: Data journalism is a (single) discipline. The 3 dimensions of data journalism. Computer-assisted reporter. News applications developer. Data visualization specialist.

E N D
Data journalism: The myths and the magic ASNE Convention Washington, DC June 25, 2013
The 3 dimensions of data journalism Computer-assisted reporter News applications developer Data visualization specialist
Computer-assisted reporter • Former home: newsroom city desk • Likely core skills: • “data state of mind” for reporting • can “interview” data – find stories in data • can negotiate for data with government agencies • Software: Excel, Access, mySQL Jennifer LaFleur Pro Publica CAR director
News applications developer • Former home: IT department or non-journalism business • Likely core skills: • “back end” (server) programming • database configuration and administration • understands what ideas are easy and hard to execute in code • Software: Ruby/Rails; Python/Django, mySQL Brian Boyer NPR News apps editor
Data visualization specialist • Former home: newsroom graphics department • Likely core skills: • can make data interesting and accessible even in static print form • understands good visual design principles • Software: Mapping (ArcGIS, Google Maps, Leaflet), Javascript visualization libraries (e.g., D3) Kat Downs Washington Post graphics director
Filling these roles in your newsroom • Almost no one has all these skills • Unless you are a major news brand, you may not be able to hire people with a long, proven track record in any of these areas • No matter whom you hire, you (and they) should expect that they will need to keep learning • Without a data-journalism culture in your newsroom, you won’t be able to keep good people • The best solution: “grow your own”: train your staff, cultivate students before they graduate • Think long term: you won’t get from 0 to 60 with a single hire
Computer-assisted reporter RESOURCES WHERE TO LOOK • IRE/NICAR • Data “boot camps” • Annual conferences • Newsroom training • NICAR-L • SPJ & Poynter training programs • PowerReporting.com (Bill Dedman) training • Journalism schools – especially those with computer-assisted reporting courses • Your own reporters who: • Already use spreadsheets in reporting • Are comfortable with math and data • Use numbers effectively in their stories
News applications developer RESOURCES WHERE TO LOOK • Courses in Web programming: • Codeacademy.com • Forjournalism.com • Lynda.com • Books on programming in Ruby, Python, Javascript • IRE/NICAR “boot camps” • Mapping • Web programming • Computer science schools – especially those with practical (not theoretical) focus • Knight Scholarships at Medill – seeking industry partners • Your own developers who: • Are interested in journalism • Participate in “OpenGov” projects • Use contemporary tools (Ruby, Python, PHP, JavaScript)
Data visualization specialist RESOURCES WHERE TO LOOK • Visualisingdata.com (Andy Kirk) courses • Alberto Cairo’s book The Functional Art • MIT Open Courseware: “How to Process, Analyze and Visualize Data” • Courses in JavaScript & mapping: • Codeacademy.com • Forjournalism.com • Journalism schools – especially with programs in news graphics • Other schools (engineering, design, etc.) with mapping or data visualization courses • Your graphic artists who: • Like working on data-intensive graphics • Are comfortable with math and data • Have some experience with GIS systems and/or Javascript
Developing a data journalism culture • Make sure at least one *editor* develops literacy in these areas • Don’t have preconceived notions about what the right presentation approach is • Develop data-related ideas as a team – with all three “dimensions” represented • Have regular events where people interested in this topic can come together and learn • Commit to ongoing development of your staff – tuition support, travel, newsroom training • Especially important: IRE’s CAR conference