Download
1 / 16
160 likes | 300 Vues
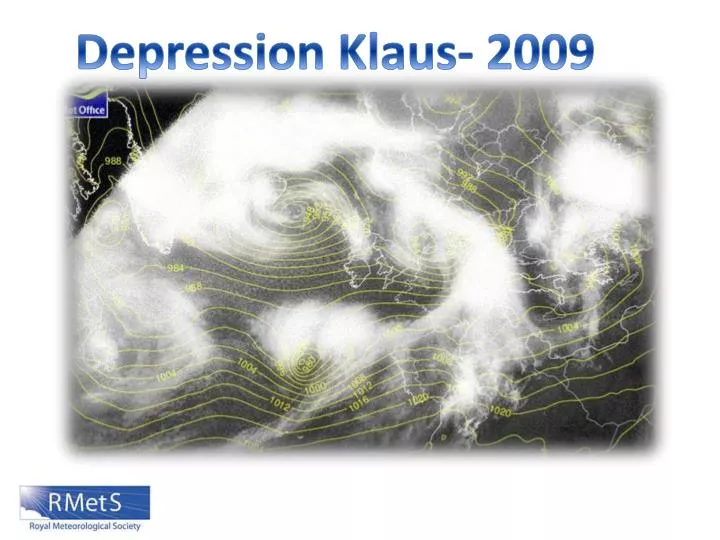
Depression Klaus- 2009. Objectives. You will be able to describe the passage of depression Klaus over the 23 rd and 24 th of January. You will be able to identify the different stages in the development of depression Klaus using satellite and temperature maps.

E N D
Objectives • You will be able to describe the passage of depression Klaus over the 23rd and 24th of January. • You will be able to identify the different stages in the development of depression Klaus using satellite and temperature maps. • You will be able to offer reasons for why depression Klaus was particularly intense compared to other storms.
Differences between polar and equatorial temperatures influence the power and strength of depressions. Weather systems help ‘normalise these differences’. At the time of the depression there was a strong temperature gradient across the Atlantic. Unusually for this depression it began further south than normal, therefore it was fed by warm and moist air from the Caribbean.
January 23rd Midnight. Old, decaying weather system over Iceland. Developing ‘hook’ of cloud caused by the cold conveyor. Cloud associated with the warm conveyor. Isobars getting closer together
January 23rd Midnight. Band of warm air feeding the depression.
January 23rd Midday. Cloud associated with the cold conveyor- wrapped around the low. Intense area of low pressure. Cloud associated with the warm conveyor.
January 23rd Midday. Cold, polar air getting wrapped around behind the area of low pressure. Warm conveyor can be clearly seen.
January 23rd Seven p.m. Intense area of rainfall as the warm front travels over the Bay of Biscay.
January 24th Midnight Intense depression- tightly packed isobars. Cold conveyor is now wrapped tightly around the system. Warm conveyor belt has been cut off from the system.
January 24th Midnight Warm conveyor belt has been cut off from the system by the hook of the cold conveyor.
January 24th Midnight Occluded front Warm front Area of lowest pressure, show by the tightly packed isobars. Cold front
January 24th Midnight Intense area of rainfall as the cold front travels over the Bay of Biscay.
January 24th Six am Rainfall begins to become less intense.
January 24th Midday Cloud associated with the cold conveyor is starting to decay. Another weather system to the West begins to develop.
January 24th Midday Cold air associated with the previous system can be clearly seen over the UK, France and Germany. New band of warm air, associated with the new weather system.
Can you? Identify depression Klaus. Identify the area of lowest pressure. Identify the warm conveyor cloud. Identify the cold conveyor cloud head.