Download
1 / 35
350 likes | 362 Vues
Training Session: Satellite Applications on Tropical Cyclones. NOAA/NESDIS ORA/CORP/RAMM CIRA / Fort Collins, CO. Outline. Tracking and Intensity Short Range Forecasting Structure. Tracking and Intensity Center location (fixing) Intensity estimates Short Range Forecasting Intensity

E N D
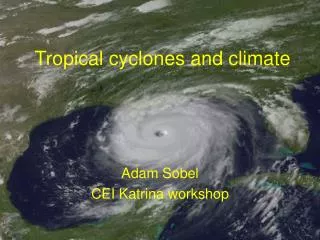
Training Session: Satellite Applications on Tropical Cyclones NOAA/NESDIS ORA/CORP/RAMM CIRA / Fort Collins, CO
Outline • Tracking and Intensity • Short Range Forecasting • Structure
Tracking and Intensity • Center location (fixing) • Intensity estimates • Short Range Forecasting • Intensity • Current trends • Vertical Shear (Assymetry) • Detection of “Rapid” Intensification • SAL (Saharan Air Layer) – LW difference images • Track • Water vapor image applications • Recurvature • Unsmoothed tracks (oscillations and wobbles) • Structure • Outer Winds • Pressure-wind relationship • Surface Wind Analysis (RMW, Size) • Subtropical Cyclones – Subtropical Transition • Hybrid Tropical Cyclones • Upper-level forcing - Subtropical • Midgets • Monsoon Depressions • Extratropical Transition • Landfall
SATELLITE DATA TYPES: • Geostationary: • IR • VIS/Ch2 • WV • Split window • Microwave sounder (AMSU) • Microwave images • Satellite winds • Scatterometer winds (also Windsat) • Microwave winds (old SSMI algorithm) • SST images • High resolution multispectral images • MODIS • AVHRR • DMSP OLS • MSG • Super Rapid-scan Operations (SRSO) (1-min interval)
Tracking and Intensity • Center location (fixing) • Intensity estimates
Center location (fixing) • Center Location = surface center • Center of circulation • Lowest sea-level pressure • Visible and IR methods – Dvorak • Eye • Distinct and inferred center with shear pattern and low-level clouds • Spiral bands and curved cloud lines • Wedge method • Using animation • Low-level cloud motions • Deep layer cloud motions • Ignore cirrus layer cloud motions • Mid-level centers tilted from surface center • Using microwave images • Thick cirrus clouds in visible and IR images obscure features below, used for center location • Thick cirrus clouds in microwave images are more transparent, and the microwave images may often provide better views of features, for improved center locations • Using scatterometer winds • Problems encountered with cyclogenesis and early stages
Center Location • Center Location = surface center • Center of circulation • Lowest sea-level pressure • Visible and IR methods – Dvorak • Eye • Distinct and inferred center with shear pattern and low-level clouds • Spiral bands and curved cloud lines • Wedge method
Center Location • Using animation • Low-level cloud motions • Deep layer cloud motions • Ignore cirrus layer cloud motions • Mid-level centers tilted from surface center
Center Location • Using microwave images • Thick cirrus clouds in visible and IR images obscure features below, used for center location • Thick cirrus clouds in microwave images are more transparent, and the microwave images may often provide better views of features, for improved center locations • Using scatterometer winds • Problems encountered with cyclogenesis and early stages
Intensity Estimates • Dvorak Technique • Objective Dvorak Technique • Advanced Microwave Sounding Unit (AMSU) • Using scatterometer winds • Other (low-level cloud motion vectors, microwave wind algorithms, in situ obs)
Tropical Cyclone Intensity • Intensity: highest surface wind speed • U.S. policy: 10-m, 1-min wind to nearest 5-knots (knot = n.mi./h, 60 n.mi. = 70 mi. = 111 km = 1 deg lat, 1 m/s = 1.946 knots) • Alternate indicator of intensity is the central pressure, or minimum sea-level pressure (MSLP) in hPa (mb)
Dvorak Technique • The Dvorak technique uses patterns and measurements from satellite imagery to estimate the strength of a tropical cyclone. • Four basic types • Curved band pattern • Shear pattern • CDO pattern • Eye pattern
Dvorak Technique • Uses patterns and measurements as seen on satellite imagery to assign a number (T number) representative of the cyclone’s strength. • The T number scale runs from 0 to 8 in increments of 0.5.
Objective Dvorak Technique • Original version – Dvorak (1984) – “analysis using digital IR data” • Velden, Olander, Zehr (1998) – ODT • Computation used for hurricane intensities remains essentially unchanged • What is it? – Two IR temperature measurements, given a center location
Two IR temperature measurements • 1) Surrounding temperature – Warmest pixel from those located on r=55 km circle • 2) Eye temperature – Warmest pixel within the eye • Table assigns intensity to nearest 0.1 T-No. • Intensity increases as Surrounding T gets colder and as the Eye T gets warmer.
Advanced Microwave Sounding Unit (AMSU) • Vertical temperature profiles retrieved from the AMSU multispectral radiances, give a 3-D measurement of the tropical cyclone warm core • Refinements to measurements of the warm core provide intensity estimates
Scatterometer winds • Surface wind vectors from the scatterometer at about 25 km resolution provide limited information for intensity estimates • The scatterometer wind speeds are not representative above minimal hurricane force, and give erroneously high winds in heavy rain areas
Low-level cloud motion vectors • 0.8 x (low-level sat wind speed) = Surface wind speed estimate
Short Range Forecasting • Intensity • Current trends • Vertical Shear (Assymetry) • Detection of “Rapid” Intensification • SAL (Saharan Air Layer) – LW difference images • Track • Water vapor image applications / Recurvature • Unsmoothed tracks (oscillations and wobbles)
Intensity Trends • Short-term changes in satellite images following Dvorak intensity measurements • Recognizing peak intensity • Short range intensity forecasts often based on current trends shown in images
Vertical Shear • Intensity changes are often due to: • Vertical wind shear of the environmental deep layer in which the tropical cyclone circulation is embedded The direction and magnitude of the vertical shear is indicated by th edeep cloud and cirrus assymetry with respect to the TC center Vertical shear is quantified by the vertical profile of the wind averaged over a large TC centered circle. The vector difference of wind at different levels is the vertical shear.
Rapid Intensification • Most large errors in intensity forecasts are due to “rapid intensification” events • Rapid intensification occurs in low vertical shear environments over very warm oceans • Satellite image characteristics associated with rapid intensification
SAL (Saharan Air Layer) • The SAL is often observed in association with dust that is transported large distances across the Atlantic from its source region in Africa • The SAL is characterized by very dry mid-level air and a stable air layer • The SAL inhibits deep convection and TC development • The long wave IR difference can be displayed as an image product to track the SAL
Water vapor images • Tropical cyclones track according to the deep layer mean wind • Water vapor images depict upper level cloud motions, and mid-level motions in cloud free areas • Features that force abrupt changes in TC track are often identified in water vapor images
Track oscillations and wobbles • Hurricanes with well defined eyes can be very accurately tracked with satellite images • The center may exhibit short term oscillations or wobbles about the track representing the longer term motion • Center relative animated images are useful in depicting short term motion
Structure • Outer Winds (Size) • Pressure-wind relationship • Surface Wind Analysis (RMW, Size) • Subtropical Cyclones – Subtropical Transition • Hybrid Tropical Cyclones • Upper-level forcing - Subtropical • Midgets • Monsoon Depressions • Extratropical Transition • Landfall
Outer Winds • The TC maximum winds are usually 10-75 km from the center. The outer winds generally decrease away from the center but are not well related to the maximum • TC size can be very different and has important implications • TC size • Radius of gale force (34 kt / 17.5 m/s) winds • Outer closed isobar • Radius of zero tangential wind
Pressure-wind relationship • Central pressure, i.e. minimum sea-level pressure (MSLP) is well correlated with maximum surface wind speed (Vmax) • An average pressure-wind relationship is used to assign intensity as MSLP and Vmax, in the absence of additional observations, such as aircraft data.
Pressure-wind relationship • Aircraft observations reveal deviations from the average pressure-wind relationship • Environmental and structure characteristics influence the pressure wind relationship • Environmental pressure • Latitude • Size • Intensity trend • TC Motion • Radius of Maximum Wind • Landfall