Download
1 / 46
460 likes | 465 Vues
Seismic motion analysis of the SuperB site of Frascati. L. Brunetti 1 , B. Bolzon 1 , A. Jeremie 1 , S. Tomassini 2 , M. Esposito 2.

E N D
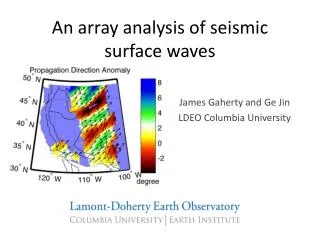
Seismic motion analysis of the SuperB site of Frascati L. Brunetti1, B. Bolzon1, A. Jeremie1, S. Tomassini2, M. Esposito2 1 : LAPP Laboratory of Particules physics at Annecy-le-Vieux, IN2P3 – CNRS – University of Savoy - France2 : LFN INFN Laboratory of Nuclear Physics at Frascati - Italia SuperB meeting at CaltechDecember 2010
Overview • Brief summary of the 1st campaign (October 2009, 2.5 days) with additional analysis • Results of the 2nd campaign (October 2010, 4 days) • Link to the stabilization and the current developments dedicated to CLIC CalTech - SuperB 2010
Brief reminder of the 1st campaign • Summary of the first campaign status (October 2009) : • Point 1 : future detector (near a main road where there is much traffic and near a power plant) • Point 2 : near the DAFNE damping ring and the main pumping station of the DAFNE cooling plant. • Point 3 : near a main road as point 1 • N.B.1: no measurements done in the holes at points 3, 4 (3: stone, 4: water) • N.B.2: all points not far from the high way and the rail-way CalTech - SuperB 2010
Instrumentation set-up • Sensors : • Data acquisition: • Acquisition system: PULSE from Brüel & Kjaer (amplifiers included) • Noise of the measurement chain, including PULSE, Guralp used from 0.2Hz to 50Hz and Endevco used from 50 to 100Hz, measured at LAPP: • allow very accurate measurements of ground motion even for a quiet site CalTech - SuperB 2010
Data analysis • FFT parameters used for the analysis of the long term measurements: • Window: Hanning • Frequency resolution: 0.016Hz • Time resolution: 20 min (54 spectra averaged for 20min each 18 hours) • Spectra average: 55 (data set of 64 s),exponential (2τ:1195s), 66.67% overlap • FFT parameters used for the other measurements: • Window: Hanning • Frequency resolution: 0.016Hz • Average : 50 (data set of 64 s), exponential (2τ:1195s), 66.67% overlap • Measurement time: 20 minutes Average of the amplitude of GM (single event noise smoothed out) Accurate measurements of transfer function and coherence • GM measured in various sites in the world by Desy team • PSDs also measured during 60s and averaged for 15 min or longe • Almost same analysis: amplitude of GM measured at NFL by us can be compared to the ones of various sites in the world CalTech - SuperB 2010
1st campaign : On surface at different pts • Comparison of ground motion for different locations : PSD of the vertical displacement • Distribution of motion versus frequency quite the same for the four locations • Amplitude almost the same (low frequency) for the four locations • → [0.2;100]Hz: ~70-80nm • → [1;100]Hz: ~30-35nm RMS of the 3 directions displacement • Nominal horizontal beam size: 160 times larger than the vertical one • Horizontal tolerances should be much less strict than vertical one • Horizontal GM not so much higher than vertical one Pt 1 • Measurement focused on the vertical direction CalTech - SuperB 2010
1st campaign : On surface and in underground (50m) • Comparison of GM between vertical / horizontal axes : • At point 1, GM measured simultaneously on the surface and on the hole of 50m depth with Endevco accelerometers (vertical direction) • (Guralp geophone diameter to large to be put inside the hole (d=70mm) ) • Results shown above 1.3Hz, frequency from where data are reliable (high signal to noise ratio) PSD Transfer Function • Above 2.4Hz (beginning of cultural noise): vibrations of surface damped in the hole • Above 20Hz: factor of damping goes up to 20 (transfer function) CalTech - SuperB 2010
1st campaign : long term measurement • PSD of ground motion versus time and frequency : Quite same spectra with time except for one area from 8h to 9h40: high increase of amplitude in the range [3; 30]Hz corresponds exactly to traffic Point 3 :New basement(rigid floor) Analysis versus time : Analysis versus frequency : Cultural noise(human activities) Microsismic peak(ex : waves of ocean) CalTech - SuperB 2010
1st campaign : coherence measurement • Setup of the measurement : • Exemple of results : rigid floor of the new basement Soft floor Rigid floor • Comparison : • Goal: confirmation of the importance of a rigid floor for stability and evaluation of the NFL floor • Comparison done with coherence measured on the ATF2 where a special floor was built for stability (same data analysis performed) • Value : frequency where the coherence highly falls (under 0.8) for each distance • Basement (and parking) floor really better than ATF2 floor although ATF2 floor was built for stability whereas basement floor was not • LNF ground: very promising for good coherence properties CalTech - SuperB 2010
Summary of the 1st campaign • Vertical ground motion measurements during 18 hours • [0.2; 1]Hz: vary from 65nm to 76nm low compared to many other sites in the world (Desy team study) but may be higher in a longer time • [1; 100]Hz: vary from 12 to 65nm (quite low) except from 8h to 9h40 Max (transient): 700 nm Max (average): 240 nm → Due to traffic observed in the range [3; 30]Hz, it increases up to :- 240nm (Average of 20’)- 700 nm (Transient of 6s) • GM measured simultaneously on surface and in a 50m depth hole • Cultural noise well attenuated in depth on its entire frequency range • →huge vibrations due to traffic should be well attenuated in depth • Very better if Super B is in underground !! CalTech - SuperB 2010
Summary of the 1st campaign • GM measured at 4 locations on surface (various vibration sources) • Almost the same (vertical GM) for the 4 pts (non rush hours the day) →GM measured for 18 hours (pt 3) well representative of LNF GM • Horiz. GM not much higher than vertical GM compared to tolerances • Coherence for different distances at 2 pts (soft and rigid floor) • Rigid floor keeps the coherence at higher frequencies than a soft floor • NFL concrete floor better than ATF2 floor (built for stability) • Very important analysis for the vibrations control strategy → More details in a INFN report and an IPAC article. CalTech - SuperB 2010
2nd campaign : objectives • To repeat and to increase the quantity of data • Short term measurement at different points • Long term measurement • Comparison of underground and surface measurement in the news holes • Coherence measurement in function of the concrete and of the location : Daɸne experiment 1 5 4 3 2 CalTech - SuperB 2010
Comparison of the 4 points on surface • Short term measurement : vertical direction • The objective was to check if the amplitudes of the cultural noise (on surface) are the same before the measurements in the 4 holes Cultural noise (vertical) on surface for the four points (vertical direction) • Amplitudes are not very important. The amplitudes reveals variations from one measurement to the other (mainly above a few herz) CalTech - SuperB 2010
Comparison between the three directions for each point • Short term measurement : RMS • Same remarks concerning the amplitudes. • → The study is focused on the Z direction, considering the tolerances (Nominal horizontal beam size: 160 times larger than the vertical one). CalTech - SuperB 2010
Instrumentation • Waterproof accelerometer support Sensor • No influence on the measurement CalTech - SuperB 2010
Magnitude of transfer function between holes and surface • Short term measurement : • Well damped in underground • The damping is various in function of the frequency • The correlation is not evident in fonction of the deepth of the holes - Nature of the ground ? - Level of the cultural noise ? - Hours of the measurement ?... → Long term measurements CalTech - SuperB 2010
Long term measurement • Point 1 (future detector) : on surface and in a 50m depthhole • FFT parameters : comparison with 2 approaches • Averages: • Window: Hanning • Overlap: 66.67% • Frequency resolution: 0.016Hz • Time resolution: 1195s (~20 minutes) (trigger of the multibuffer, whose size is of 52) • Averaging: Exponential (2*Tau=1195s) with 54 averages (data sets of 64s averaged) • Transient: • Window: Hanning • Frequency resolution: 0.1563Hz • Time resolution: 6s (trigger of the multibuffer, whose size is of 52) • Averaging: Exponential (2*Tau=6.4s) with 1 average CalTech - SuperB 2010
Long term measurement • Integrated RMS from 1.3Hz to 100Hz : Point 1 • Evolution of the amplitude with cultural noise (day and night) • Sigma very important on surface (→ real time vibration control) • Sigma and mean well damped in the hole • Seems that the ratio is higher when cultural noise is higher (see next slide) CalTech - SuperB 2010
Long term measurement • Ratio of the integrated RMS between the hole and surface : Highestdamping Lowestdamping Medium damping Medium damping 2 • Check of the transfer function versus frequency for these 4 different damping factors • Compare also with the data of last year CalTech - SuperB 2010
Long term measurement • Transfer function magnitude between surface and hole : Siesmic Steady Variable • 1,3 – ~8 Hz : about the same damping • >8 Hz (traffic…) : various damping in function of the hours and the date. • Efficient damping in underground. • Possible to have a good evaluation of the ground motion damping of a site in underground only on a certain bandwidth. CalTech - SuperB 2010
Long term measurement : Daɸne • 2 objectives : • GM measurement experiment ON • Support of QD0 experiment ON CalTech - SuperB 2010
Long term measurement : Daɸne • RMS of the ground motion and QDO support, experiment ON Peaks • 21 hours of measurements • → First 7 hours: very high peaks of vibrations • → Then: mean very stable versus time and sigma very small : vibrations quite small on the floor and QD0 CalTech - SuperB 2010
Long term measurement : Daɸne • Comparison GM and QDO : • After 7 hours: only a factor 2 in average and only up to a factor 3 in transient !! → Very good supports from the ground to QD0 • First 7 hours: up to a factor 70 in average and to a factor 600 in transient !! CalTech - SuperB 2010
Long term measurement : Daɸne • RMS in function of the frequencies : • Above 5Hz: high peaks of vibrations during the first 7 hours disappear • < 5hz : has to be correlated with the activities of the experiment at this period CalTech - SuperB 2010
Long term measurement : Daɸne • Transfer in function of the time : • From 12h00 to 18h20: • Huge peaks of vibrations up to 5Hz • Globally, decrease with time CalTech - SuperB 2010
Long term measurement : Daɸne • Transfer in function of the time : • From 18h40 to 8h20 : • Peaks of vibrations below 5Hz diseapear • Resonances not very big on QD0 support • → Very good mechanical supports between QD0 and the floor!! • 8h20-8h40: • - Peaks of vibrations below 5Hz appears one more time • Conclusion: huge peaks of vibrations below 5Hz appears the day and diseapear the night • Something off the night in the machine? CalTech - SuperB 2010
Long term measurement : Daɸne • Comparison of ground motion between vertical and horizontal directions • Vertical and horizontal direction: not big difference of amplitude • The two directions seem correlated above 1Hz CalTech - SuperB 2010
Coherence measurement : Daɸne • Setup of measurement: Wall in front of the KLOE detector • Measurements in the 3 directions CalTech - SuperB 2010
Coherence measurement : Daɸne • Vertical direction : Fall of coherence due to low signal to noise ratio • Value : frequency where the coherence highly falls (under 0.8) for each distance 7,7 6 20 30 21 7,3 CalTech - SuperB 2010
Coherence measurement • Comparison beetween different types of concrete of the LNF and ATF2 : • DAɸNE floor less good than the basement (and parking), but better than ATF2 floor although ATF2 floor was built for stability • Can be due to the discontinuity of the concrete. • However, LNF ground seems promising for good coherence properties • One have to take care on the quality of the concrete CalTech - SuperB 2010
Summary of the 2nd campaign • GM measured simultaneously on surface (various vibrations sources) and in different depth holes • Cultural noise well attenuated in depth on its entire frequency range. • Difficulties to correlate the attenuation between the different points with short term measurements. • The damping is function of the cultural noise level. • Horizontal GM not much higher than vertical GM compared to tolerances. • Coherence for different distances at 2 pts in the Daɸne • The type of the concrete is very important (comparision basement and Daɸne) • Daɸne QDO motion and experiment influence • The structure is quite rigid even if it was not made for vibrations • The influence of the process can be very important • A lot of datas which are very important for the stabilization strategy • It still some analysis but LNF seems to be a good site for vibrations • Other sites comparison (Tor Vergata, LHC, Desy data…) → a INFN report is under progress. CalTech - SuperB 2010
Stabilization CalTech - SuperB 2010
Stabilization • Link between the measurement and the strategy of stabilization (final focus) • The target is to have a differential motion between the 2 beams lower than the tolerances • The approach will be selected in function of : • The specifications • The distance between the 2 last QD0 • The coherence of the ground motion • The level of the ground motion • The mechanical properties of the QD0 et its support • The influence of the internal system • The beam repetition rate • … • The simulation of the whole system can be started thanks to the measurements. • Ex of applications : ATF2 and the current developments dedicated to CLIC CalTech - SuperB 2010
2 possible approaches • Rigid support : ATF2 approach (transfer function of 1 and no influence of the cooling) • Easiest approach but limited • Use of beeswax and a honeycomb table in order to obtain a very good transmission of the floor vibrations. • Small influence of the cooling Transfer function of ~1 between the floor and the support Beeswax • The differential motion between QD0 and the Target is under the specifications. No beeswax (fixed on the floor) • Active isolation : CLIC approach : • More complex CalTech - SuperB 2010 34
CLIC beam trajectory control strategy • Association of different actions: • [0 (fb/~10)] : beam trajectory correction until 3 - 4 Hz F1 • [(fb/~10) 100+] : mechanical correction - Active / passive isolation M1 - Active compensation M2 (fb = 50 Hz) • The beam control states the specifications of the mecanical control : RMS @ 3 Hz • Mechanical scheme: Action F1 Action M2 Action M1 CalTech - SuperB 2010
Stabilization strategy • Feedback setup: • Parametric linear Controlleroptimized to minimize the PSD of displacement of the beam (∆Y) in function of the disturbance seismicmotion • Adaptive filter based on the recursive least square (RLS) algorithm, designed to minimize the prediction error Static gain Go • Determination of the pattern of the global Active/passive isolation Resonant frequency f0 [Hz] Example if we consider Active isolation as a second order low pass filter: Independent from ξ in the range [0.01 – 0.7] CalTech - SuperB 2010
Active passive isolation • Industrial solution : TMC table • Composed of one rigid bloc and 4 active feet - Passive isolation: High frequency attenuation but amplification of very low frequency (resonant filter) - Active isolation: Attenuation of the previous amplified disturbances -Attenuation down to 0.2nm at 4Hz -Already over the specifications (0.1nm) -Expensive system CalTech - SuperB 2010
Feasibility demonstration • Simulation done with the CMS detector data measurement • With industrial products - + + + + - = + BPMnoise f0 = 2Hz ξ = 0.01 TMC table (K1) Mechanical damper (K2) Seismic motion (CMS data) TMC Table (K1) Mechanical damper(K2) + + Adaptive filter Direct disturbances + + Y=0 Actuator (Kicker) Controller Position at the IP: ∆Y MAGNET Sensor (BPM) ACTIVE/PASSIVE ISOLATION CalTech - SuperB 2010
Feasibility demonstration • Results : • Robustness is ok • Specifications are respected • Tests under progress in PLACET with CERN CalTech - SuperB 2010
Feasibility demonstration Mid-lower magnet • Solution under progress : Lower electrode of the capacitive sensor V-support for the magnet 1355mm Elastomeric strips for guidance Fine adjustments for capacitive sensor (tilt and distance) Piezoelectric actuator 2mV=0.1nm CalTech - SuperB 2010
Active compensation • Feasibility demonstration on a prototype: • Demonstration of a mecanical control at a sub-nanometer scale • Can be used like an additionnal control if the there are disturbances due to the experiment itself CalTech - SuperB 2010 41
Summary of our activities dedicated to the control part • Methodology of the stabilization of the future Compact Linear Collider • - Dedicated instrumentation (Sensors, actuators, filters, acquisition system etc…) • - Association of controls : active / passive isolation, active compensation, beam trajectory • control • - Feasibility demonstration of the beam stabilization and active compensation • - New specification of the active/passive isolation • Current activities : • Implementation of the control of the home made mechanical isolation and tests • Implementation of the beam control strategy in a beam accelerator simulation (PLACET) and test on a prototype. • Future prospects : • The limitation is the sensor : future study in order to use the mass of the magnet CalTech - SuperB 2010
Spares CalTech - SuperB 2010
X direction Fall of coherence due to low signal to noise ratio CalTech - SuperB 2010
Y direction Fall of coherence due to low signal to noise ratio CalTech - SuperB 2010
Long term measurement • Integrated RMS from 10Hz to 100Hz : • Integrated RMS from 50Hz to 100Hz : CalTech - SuperB 2010