Download
1 / 21
210 likes | 319 Vues
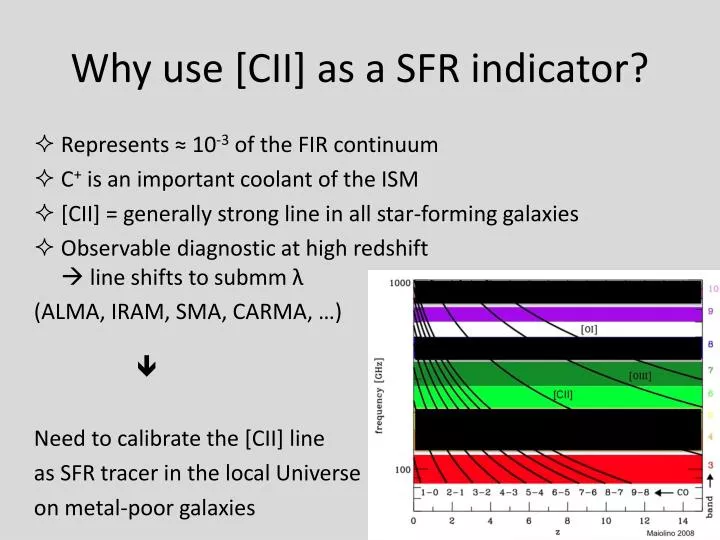
Why use [CII] as a SFR indicator?. Represents ≈ 10 -3 of the FIR continuum C + is an important coolant of the ISM [CII] = generally strong line in all star-forming galaxies Observable diagnostic at high redshift line shifts to submm λ (ALMA, IRAM, SMA, CARMA, …)

E N D
Why use [CII] as a SFR indicator? • Represents ≈ 10-3 of the FIR continuum • C+ is an important coolant of the ISM • [CII] = generally strong line in all star-forming galaxies • Observable diagnostic at high redshift line shifts to submm λ (ALMA, IRAM, SMA, CARMA, …) Need to calibrate the [CII] line as SFR tracer in the local Universe on metal-poor galaxies
Previous calibrations Boselli et al. (2002) • calibration of SFR relation based on Hα+[NII] and [CII] ISO data dispersion LHα – L[CII] relation: ≈ 3 uncertainty on SFR estimate: ≈ 10 Conclusion: large dispersion in SFR-L[CII] relation due to different contributions to [CII] emission in galaxies BUT: large uncertainty on [NII] correction and Hα extinction
Previous calibrations De Looze et al. (2011) • calibration of SFR relation based on FUV+24 μm data ISO [CII] data from Brauher+ 2008 • unresolved with respect to 75” ISO LWS beam no aperture correction required • No active galactic nucleus (AGN) sample of 24 galaxies
Previous calibrations De Looze et al. (2011) • tight correlation betweenSFR and L[CII] • less dispersion (0.27 dex) than in Boselli et al.(2002) BUT • Limited sample of merely metal-rich galaxies • No spatially resolved observations no constraint on origin of C+ SFR [M/yr] = (L[CII] [erg/s])0.983 1.028x1040
Previous calibrations Sargsyan et al. (2012) • [CII] can be used as SFR tracerin starburst galaxies • deficiency in [CII] for AGNsdue to contribution fromAGN to LIR (see also Herrera-Camus et al. in prep.) Conclusions: [CII] = reliable SFR indicator in normal star-forming galaxies, possibly also in AGNs
DGS Survey • Sample of 48 dwarf galaxies • Covering wide range in 1/50 Z≤ Z ≤ Z • allows studying the effect of metal abundance on the ISM physics, SF, level of ionization, ISM filling factors, etc. • Subsample of 14 objects < 10 Mpc • high spatial resolution • disentangle ≠ ISM phases • study the resolved SF law
Reference SFR tracer? • Below 12+log(O/H) < 8.1 need to trace unobscured + obscured SF FUV or Hα • 8 μm PDR origin, absent in HII • 24 μm peaks in HII • FIR (70, 100, 160 μm) • TIR luminosity drawbacks: - heating by old stellar population- submm excess MIR 24 μm is only SFR calibrator that also SPATIALLY correlates with SF
Global [CII]-SFR relation • [CII]-SFR relation for DGS sample ± consistent with relations for metal-rich samples (but larger dispersion) • Offset for subsample 12+log(O/H) ≥ 8.1 consistent with Sargsyan et al. (2012)
Resolved [CII]-SFR relation All pixels rebinned to physical size of (436 pc)2,i.e. (12”) 2 at 7.5 Mpc independent pixels of size ≈ beam at 158 μm trace same regions within galaxies proxy for surface density of gas/SFR • [CII]-SFR relation:Individual galaxies • similar slopes • BUT with offset galaxies have - higher [CII] • OR • lower SFR
Cause of offset in [CII]-SFR relation? • higher [CII]? = different [CII] behavior in galaxies? • lower SFR? =various SF conditions/efficiency? Differences in: • Metal abundance? II. Photoelectric efficiency? III. Relative fraction of gas phases contributing to [CII]?
I. Metal abundance Offset in [CII]-SFR relation clearly influenced by metal abundance! How does metallicity influence- ISM conditions (ISRF, density)? - PAH/VSG abundance? - star formation efficiency? Resolved Global
Influence of Z? • Lower Z less dust longer free path lengths FUV photons enlarge C+ emitting zone higher [CII]/TIR ≈ photoelectric efficiency (PE) • Lower Z peculiar grain properties dearth of PAHs: due to grain charging/PAH destruction high abundance of very small grains (VSGs):large grain fragmentation due to shocks in turbulent ISM PAHs/VSGs dominate PE outcome on PE???
II. Photoelectric efficiency ε ≈ [CII]/TIR • Large spread in PE up to 2 orders of mag • No clear dependence of metal abundance effect of metallicity on [CII]/TIR is non-trivial • Declining [CII]/TIR & [CII]+[OI]/TIR ratio within galaxies for higher LTIR
Dispersion due to ε ≈ [CII]/TIR Global Resolved • Highest values LCII for [CII]/TIR • Obvious trend of [CII]/TIR with offset in SFR-L[CII] relation ! lower photoelectric efficiency = lower [CII] luminosity • Lower metallicity • no clear trend with [CII]/TIR
Photoelectric efficiency ε’ ≈ [CII]/PAH • Little spread in PE < 1 order of mag • Constancy of [CII]/PAH throughout galaxies [CII] emission & PAHs physically linked through photoelectric effect, better than for all grains(see also Croxall et al. 2012, Lebouteiller et al. 2012)
Dispersion due to ε’ ≈ [CII]/PAH • Offset in SFR-LCII relation for metal-poor galaxies with CII/PAH ≥ 0.05 • Higher CII/PAH decreased LCII for a certain level of SF photo-electric effect on PAHs more efficient @ low-Z ? • rather reflects lower PAH emission (≈ abundance)
III. Ionized gas contribution to C+ Most common diagnostic [CII]158/[NII]205 BUT no [NII]205 detections Alternative diagnostic [CII]158/[NII]122 12/48 galaxies with [NII]122 observations Drawback [CII]158,ion/[NII]122 depends on ne!! need for reliable estimate of electron density ne Croxall+ 2012
III. Ionized gas contribution to C+ For ne ≈ 15 cm-3 ne ≈ 100 cm-3 • On global scales: ionized gas contribution < 20 % • Locally: ionized gas phases might dominate C+ contribution in diffuse regions BUT globally [CII]diffuse/[CII]HII << 1
Origin of SFR-[CII] relation? • ΣSFR-Σ[CII] law shows Schmidt-like behavior? more gas ≈ higher SFR?BUT absence of [CII] in quiescent molecular clouds trend = different beam filling factors of PDRs in regions • OR • Spatial link between CII emission from PDRs and adjacent HII regions global CII emission in galaxies is dominated by PDRs cooling efficiency in PDRs is linked to star formation activity(higher SFR increased input for gas heating more cooling through [CII] • • resulting in tight correlation of [CII] with SFR
Conclusions • [CII]-SFR relation DGS sample more or less consistent with De Looze et al.(2011) and Sargsyan et al.(2012) holds for lower-metallicity galaxies • Dispersion in [CII]-SFR relation for individual galaxies driven by photoelectricefficiency: higher [CII] OR lower SF for 12 + log(O/H) ≥ 8.1 • Metallicity has influence on photoelectric effect differences in grain abundance (PAHs, VSGs) • Origin of SFR-[CII] relation consistent with dominant PDR origin of C+
Future work • Determine PAH-VSG abundance (use spectroscopy as well!) + quantify precise influence on dispersion of [CII]-SFR relation • Identify best SFR calibrator for [CII] FUV/Hα, 8/24/70/100/160 or TIR luminosity? • Determine CII/TIR-dependent (or Z dependent) SFR-[CII] relation • Extend [CII]-SFR relation to - more metal-rich objects (12 + log (O/H) ≥ 8.5)- high redshift objects • Calibration of other FIR-lines ([OIII]88,[OI]63,…)as possible SFR tracers