Download
1 / 10
100 likes | 228 Vues
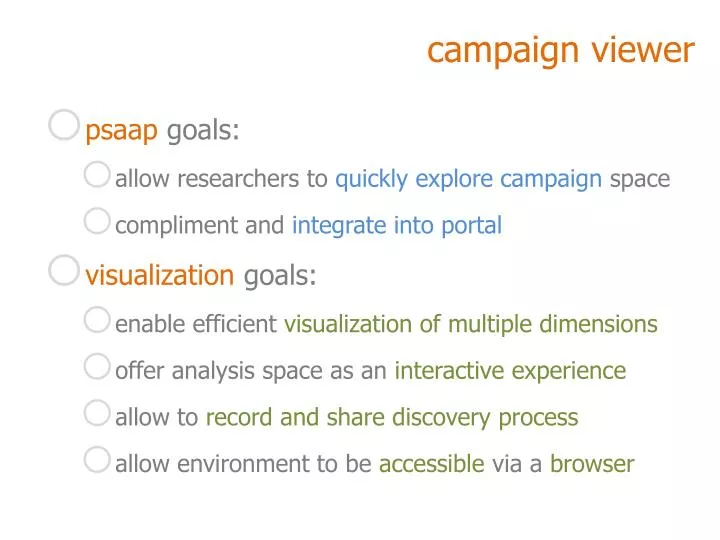
campaign viewer. psaap goals: allow researchers to quickly explore campaign space compliment and integrate into portal visualization goals: enable efficient visualization of multiple dimensions offer analysis space as an interactive experience

E N D
campaign viewer • psaapgoals: • allow researchers to quickly explore campaign space • compliment and integrate into portal • visualization goals: • enable efficient visualization of multiple dimensions • offer analysis space as an interactive experience • allow to record and share discovery process • allow environment to be accessible via a browser
STRATEGIES FORmultivariate visualization LIMITATIONS • limited visual space • limited visual comprehension DESIGN CONSIDERATIONS • complex data better understoodlayered representation • reading order (levels of importance) • i.e. emphasizing/de-emphasizing different components of representation • data discretized/binned • offer >6 visual dimensions • create interactive/intuitive space
interactivity considerations • allow direct interaction • make objects (variables/dimensions) draggable • make rendered datapoints interactive • allow efficient interaction • easy navigation of variable-dimension coupling • via keystrokes • via clicking • via dragging
browser considerations • use new standards/technologies • html5 • drag/drop • canvas (vs embedded svg) • use standard client/server communication api • XMLHttpRequest • xml formatted data collections • xml formatted data • xml formatted scripts
canvas vssvg • canvas • + html element with direct js access • +currently faster/more stable (under chosen browsers) • - generates pixel represention • - interativity needs to be added separately • svg • - requires connections to html document (and back) • + generates vector based representation • + interactivity can be encoded in visual elements • + xml format
scripting considerations • allow to record interactive session • allow edit scripts • allow to save/share/publish • scripts can be stepped through • with same or different data • keep data/environment interactive along replay • make scripting/replay seamless
portal integration • enable collaborative data analysis • plots+scriptingas part of sharable information • leading into web based collaborative dashboard • dashboard= information summary suggested actions • sample, see IBM’s Dashiki/ManyEyeswikified • data grouping • definition of batch-jobs/campaigns (custom subsets) • allows for targeted/better defined data analysis
application backend • goal: allow for easy access to data, optimized for grouping • object-oriented approach to group creation • strong representation of each simulation • Djangoimplementation • Python based classes • creation of classes to represent simulations, targets, projectiles,.. • + flexibility allows for modified/new model paradigms • enables manipulation from pre-existing python code and libraries • still in development stage
application backend: django • implementation using jinja2 template language • increased freedom in template design • + extends django templates with custom method calls • .i.e. passing of arbitrary arguments to functions • developed with the django-command-extensions • easy database-insensitive backup • exports the database using django’sapi • i.e. programmatically adds entries to the database using python • + other added features • e.g. automated way to graphically represent database backend
current development • developed using new html5 standards • developed in Safari • some testing on portable device (iPad) • some testing on Mozilla based browsers • implemented basic interactivity • drag/drop • keystroke navigation • script recording/playback • dynamic loading