Download
1 / 13
130 likes | 264 Vues
Random Variables. -2 -1 0 1 2. Here I have reproduced a number line. I did this because we will use the number line.

E N D
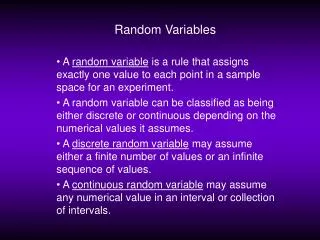
-2 -1 0 1 2 Here I have reproduced a number line. I did this because we will use the number line. Remember a variable is a concept that can have a different value from subject to subject. An example might be daily Big Mac units sold during the lunch hour at the Wayne McDonalds. Each day (daily lunch hour units sold is the subject) could have a different value. Another example might be the temperature in Wayne during the lunch hour. On the number line we have the variable of interest. The amount of the number line we use depends on the thing we study.
Consider an experiment as a process that generates well defined outcomes. From our McDonalds example, each day is a new experiment where the daily units sold are well defined. But at the beginning of the day we do not know what the sales will be. Now I want to tell you about something called a random variable. A random variable is a numerical description of the outcome of an experiment. Each experimental outcome gets assigned a numerical value. In fact, most of the time the experimental outcome is a number so we just use that number as the number we assign. You could also say that a random variable is a function or rule that assigns a number to each outcome of an experiment. Random variables can be discrete or continuous. I was at a conference once and a guy told a joke about the difference between these two types of random variables (oh yes, the conference was really scintillating! – next screen for the joke)
The guy said he would give 50 bucks to the person or people (there were about 300 people in the room) who could guess the number between 1 and 10 that he had written on a card before the evening. He paused a moment and gave each of us a chance to write a number down. He then said his number was something like 6.732158497341 Get it? Arrrrrrrrrrrrrrrr Now here is the point. We all assumed he meant discrete values between 1 and 10 (discrete really means more than just integer values, but this is all we need at this time.) He meant continuous. Think back to the number line. Pick two points on the line - any two points you want. If all the number line between those two points can also be consider values for the random variable, then the variable is continuous. But if only some values between the points can be consider as possible values, then the variable is discrete. See next screen for examples.
Have you every gone into a gas station with a food shop? Sure you have! Now, have you every gone over to the cold pop section and then you looked and saw a pop bottle have less than a full bottle of fluid? I did once and a still bought it. It was the old glass coke bottle and it had no pop it, but was sealed as tight as a drum. Novelty, you know. I can’t find that bottle now. The ounces of fluid in a bottle is a continuous variable because, at least in theory with a really good measuring device, we could get really precise measures. All the number line from 0 to 20.2 ounces could happen. An example of a discrete variable could be the number of people who shop at the gas station that day. We would just have the values 1, 2, 3, but the fractions in between each number would not be part of the variable.
Probability Distribution A probability distribution for a random variable is very similar to a frequency distribution that we saw before. Essentially we have probabilities associated with each value of the random variable. When the variable is discrete the probability distribution is called a probability function and often denoted P(X). Let’s do an example. The random variable, X, is the number of cars you have called your own. The possible values (in this example) are 1, 2, 3, or 4. On the next screen we show these values and the associated probabilities found by observing what happened over 20 people observed. Note in general we talk about Xi as the ith possible value. Here the values go from 1 to 4.
Remember P(X) represents probabilities. Note each value of Xi has P(Xi) 0, and the sum of the probabilities equals 1. The second part is written ΣP(Xi) = 1. Our example has these properties. The graph assists in seeing which outcome has the highest probability. With the probability values we can answer questions about likelihood of events. An example would be what is the probability a randomly chosen person had 1 or 4 cars? Answer = .15 + .2 = .35 (this is an or statement, a union with no overlap). Xi P(Xi) 1 3/20 = .15 2 5/20 = .25 3 8/20 = .4 4 4/20 = .2 Probability .4 .3 .2 .1 1 2 3 4 Number of cars
Expected Value or Mean The expected value of a discrete random variable is a measure of central location and is called mu, μ. The expected value has the formula E(X) = μ = ΣXiP(Xi). XiP(Xi) is the product of each value of the variable and its probability, and this is added across the values of the variable. From our car example we have μ = 1(.15) + 2(.25) + 3(.4) + 4(.2) = 2.65. The values could be 1, 2, 3, or 4 and we see the average amount is 2.65. So note the expected value does not have to be one of the discrete values in the problem.
Variance The variance and associated standard deviation are used to measure the variability of the random variable. The formula for the variance is Var(x) = σ2 = Σ (Xi – E(X))2P(Xi). For our car example we have (1 - 2.65)2(.15) + (2 - 2.65)2(.25) + (3 - 2.65)2(.4) + (4 - 2.65)2(.2) = .41 + .11 + .05 + .36 = .93, and the standard deviation is the square root of .93, or .96
Expected value and variance Expected value The expected value is a number we look to as an indicator of the center of the data. I have the arrows point in both directions to remind you variance and standard deviation are measures of how spread out, or variable, the data are.
An example Distribution C Distribution D X P(X) X P(X) 0 .2 0 .1 1 .2 1 .2 2 .2 2 .4 3 .2 3 .2 4 .2 4 .1 Compute the expected value for each distribution Compute the standard deviation for each distribution c) Compare and contrast the results of distributions C and D.
a. For distribution C the expected value is 0(.2) + 1(.2) + 2(.2) + 3(.2) + 4(.2) = 0 + .2 + .4 + .6 + .8 = 2 For distribution D the expected value is 0(.1) + 1(.2) + 2(.4) + 3(.2) + 4(.1) = 0 + .2 + .8 + .6 + .4 = 2 b. For distribution C the standard deviation is found as the square root of the variance. The variance is [(0 – 2)^2].2 + [(1 – 2)^2].2 + [(2– 2)^2].2 + [(3 – 2)^2].2 + [(4 – 2)^2].2 = 4(.2) + 1(.2) + 0(.2) + 1(.2) + 4(.2) = .8 + .2 + 0 + .2 + .8 = 2 So, the standard deviation is square root of 2 (=1.414).
Problem continued For distribution D the standard deviation is found as the square root of the variance. The variance is [(0 – 2)^2].1 + [(1 – 2)^2].2 + [(2– 2)^2].4+ [(3 – 2)^2].2 + [(4 – 2)^2].1 = 4(.1) + 1(.2) + 0(.4) + 1(.2) + 4(.1) = .4 + .2 + 0 + .2 + .4 = 1.2 So, the standard deviation is square root of 1.2 (=1.095). c. The distributions have the same expected value. Distribution D has a smaller standard deviation and is thus less spread out. Note each distribution has the same possible values(the 0, 1, 2, 3, and 4)and values away from 2 occur less frequently for distribution D and thus it has smaller standard deviation.