Download
1 / 31
310 likes | 449 Vues
SINCIERE Member Forum Beijing, 2007.10.27-29. Emission and dispersion of Polycyclic aromatic hydrocarbons in China. S. Tao, Y.X. Zhang, C. Lang Laboratory for Earth Surface Processes Peking University. 1. INTRODUCTION EMISSION INVENTORY DISPERSION MODELING IN GUANGDONG.

E N D
SINCIERE Member Forum Beijing, 2007.10.27-29 Emission anddispersion of Polycyclic aromatic hydrocarbons in China S. Tao, Y.X. Zhang, C. Lang Laboratory for Earth Surface Processes Peking University
1 • INTRODUCTION • EMISSION INVENTORY • DISPERSION MODELING IN GUANGDONG
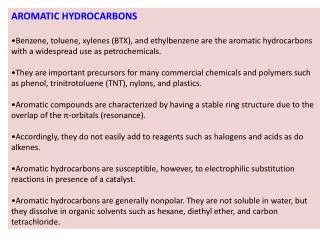
PAH CONTAMINATION IN CHINA extensive contamination of various media including food Mai et al., 2002; Shi et al., 2005; Wu et al., 2005; Zhang et al., 2005; Zhu et al., 2005 particularly important in China both regionally and globally Regionally Based Assessment of Toxic Substances, UNEP Chemicals, 2003
3 1.8 lg(ng/m ) 1.0 - 0.3 BaPeq National Standard 10 ng BaPeq/m3 China Exceedence: 4% area, 41% population LOCAL EXPOSURE RISK Ambient air, 2m height, Tianjin Tao et al., ES&T, 2006
LONG-RANGE TRANSPORT Primbs et al., ES&T, 2007
OBJECTIVE to develop an PAH emission inventory for China to model the dispersion of PAHs in Guangdong
2 • INTRODUCTION • EMISSION INVENTORY • DISPERSION MODELING IN GUANGDONG
Emissions of individual PAHs and PAH16 NAP ACY ACE FLO PHE ANT FLA PYR BaA CHR BbF BkF BaP IcdP DahA BghiP Fuel consumption at provincial level Firewood, straw, domestic coal, industrial coal, coking, vehicle gas, other gas, natural gas METHODOLOGY Modeling the fuel consumption Prediction of fuel consumption at km2 resolution Emission factors from the literature Uncertainty analysis – Monte Carlo simulation
EMISSION DENSITY / INTENSICY Emission density Emission intensity
Small scale coke 27.2% Firewood burning 21.2% Indoor straw burning 34.6% Open fire Straw burning 2.4% MAJOR EMISSION SOURCES Large scale coke production, 1.1% Domestic coal, 6.8% Industrial coal, 1.5% Traffic oil, 2.5% Al production, 0.9% Consumer products, 0.9% Others, 0.9%
1.2E+04 1.4E+05 y = 6.844x 7.0E+04 7.0E+04 6.0E+03 2 R = 0.7867 Sichuan Guangdong Ind coal BIofuel, 104 ton 3.5E+04 Taiwan Taiwan Ind oil Henan 0.0E+00 0.0E+00 Hong Kong 0.0E+00 15000 30000 GDP23 0 4000 8000 0 12500 25000 Agri. Population, 104 GDP23 20000 3.0E+04 Heilongjiang 15000 Measured Traffic oil 10000 Hebei 5000 1.5E+04 Guizhou 0 0 10000 20000 0 GDP23 Observed 0.0E+00 28000 14000 0 ENERGY CONSUMPTION MODELING Industrial coal Industrial oil Biofule Domestic coal Based on population and temperature Traffic oil
1.E+05 1.E+05 1.E+04 1.E+00 1.E+00 1.E+05 1.E+02 1.E+00 1.E+00 1.E+05 1.E+00 1.E+00 1.E+02 1.E+04 MODEL VALIDATION Model validation Model validation Model validation
MODEL UNCERTAINTY Relative variation index (RVI=SR(semi-interquartile ranges)/ median) Range from 13.9% indoor straw burning to 37.6% small-scale coke production Primarily from activity (straw) or emission factor (others)
EMISSION DENSITY km2 resolution Annual aerosol optical depth, MODIS
UK, 1995 VALIDATION transportation Incineration Incineration Aluminum Coking Aviation ind. Ind. coal USA, 1990 EU countries- BaP
6 2.5 y = -0.82529 x + 2.80241 3 0.5 Emission density, log(Gg/y) Residual, log(Gg/y) 0 y = 0.85203 x - 3.60540 -3 -1.5 2 5 8 11 2 3 4 5 GDP, log(USD) Income, log(USD/y) EMISSION vs. GDP and Income LgEmission = 1.016 lgGDP – 0.961 lgIncome – 4.582 r2 = 0.843, n = 168,
SUMMARY Total emission of PAH16 in China: 116,000 ton in 2003 10% carcinogenic compounds Major sources: indoor biomass burning, small-scale coke ovens Increased over time Global emission of PAH16: 522,000 ton in 2003
3 • INTRODUCTION • EMISSION INVENTORY • DISPERSION MODELINGIN GUANGDONG
METHODOLOGY Spatial resolved emission Forward trajectories (HYSPLIT) Partitioning, degradation, dry/wet deposition Potential Receptor Influence Function (PRIF) The probability of PAHs arriving at a receptor site, or cell, during a given emission duration and a known period of transport time
China Guangdong EMISSION OF PHE, FLA, PYR, BaP in 2001 210,000 km2, over 80 million population 60 x 60 km2 resolution
ANNUAL MEAN OUTFLOW OF PYRENE 2001 Annual mean PRIF (PYR) from Guangdong based on daily trajectory calculation Total PRIF: 5.37x10⁻¹, 2.56x10⁻³ and 8.92x10⁻⁵
SEASONAL VARIATION IN OUTFLOW Summer vs. winter The East Asian monsoons domination
SPECIAL WEATHER CONDITIONS Stagnation (May 7, 2001), typhoon (July 6, 2001), uplifting (Jan. 23, 2001) One day emission, 5 days transport
INTERANNUAL VARIATION PYRENE 0-5 day transport period, three sites representing source and receptor regions PRIFs peaked in Dec. in southeast Asia (P2) and in July in northern China (P3) Abnormally high (low) PRIF – cold (warm) episodes (Ocean Nino Index)
MODELING FOR CHINA, PRELIMINARY Forward trajectory, PRIF PRIF of PYR and BaP Euler atmospheric transport model coupled with a fugacity multi-media model Resolution: 24 km x 24km x 12 min 1.5, 3.9, 10, 100, 500, 1000, 2000, 3000, 7000 m Annual mean conc. at 1.5 m height, log(pg/m3
SUMMARY 48% remained in Guangdong under 200 m in 5 days PAHs traveled to south and southeast predominantly Strong seasonality Occasionally uplifted and traveled toward the Pacific
FINANCIAL SUPPORT NATIONAL SCIENTIFIC FOUNDATION OF CHINA ACKNOWLEDGEMENT