Download
1 / 45
450 likes | 575 Vues
Prenatal Exposures to Polycyclic Aromatic Hydrocarbons and Childhood Obesity Andrew Rundle, Dr.P.H . Associate Professor of Epidemiology Mailman School of Public Health Columbia University. Childhood Obesity In NYC Elementary Schools by Ethnicity (2007-2008). N=311,953.

E N D
Prenatal Exposures to Polycyclic Aromatic Hydrocarbons and Childhood Obesity Andrew Rundle, Dr.P.H. Associate Professor of Epidemiology Mailman School of Public Health Columbia University
Childhood Obesity In NYC Elementary Schools by Ethnicity (2007-2008) N=311,953
Evaluation of Childhood Obesity • Data on height, weight, age and gender are required. • These data can be used with CDC growth charts to estimate the BMI percentile for age and gender. • CDC has released a SAS macro to calculate BMI Z-score and BMI percentile. • The calculation of BMI Z-score and percentile uses data from NHANES from the last 30 years as a standard.
Issues in Evaluating Childhood Obesity: Changing Definitions
BMI Z-Score for 10-11 Year Olds in New York City Schools Mean = 0.71 Median = 0.86
BMI Percentile for 10-11 Year Olds in New York City Schools Mean = 69th Median = 81st 25% are obese
Endocrine Disruptors and Obesity • Growing concern that exposuresto “endocrine disruptor (ED)” chemicals, may alter metabolic programming in early life and cause obesity/metabolic syndrome. • EDs are often referred to as hormone mimics since they imitate hormones and disrupt normal cell signaling.
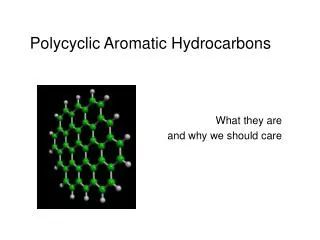
Endocrine Disruptors and Obesity Polycyclic aromatic hydrocarbons (PAH) • PAH, particularly hydroxy-PAH, have been shown to have estrogenic effects. • Induce estrogen-dependent cell proliferation. • In adipocyte cell culture experiments B[a]P inhibit lipolysis. • Shown to induce weight gain & gain in fat mass in rats and mice.
CCCEH Birth Cohort • Pregnant African American and Dominican women were recruited during their 3rd trimester through prenatal clinics in N. Manhattan. • Key entrance criteria: registered with OB/GYN clinic by 20th week of pregnancy, non-smoker, non-diabetic, non-hypertensive and lived in Bronx or N. Manhattan. • 48 hour personal air monitoring for 8 carcinogenic PAH. • Child’s height & weight measured at age 5 & 7, body composition measured at age 7.
Conceptual Design of the CCCEH Birth Cohort Obesity Project Maternal Obesity Neighborhood social and physical context Risk of obesity and Metabolic Syndrome Childhood growth trajectories Prenatal PAH & BPA exposure Early life PAH & BPA exposure
Prenatal Air Monitoring in the CCCEH • Particles (PM2.5) and vapor phase were collected and analyzed for PAH. • Concentrations of the 8 PAH were summed for statistical analyses. • Motion detectors were placed in a sub-set of bags to monitor compliance.
Anthropometric Outcome Measures. • Age 5 • Height measured by SECA wall mounted stadiometer. • Weight measured by Detecto Cardinal 750 digital scale. • Age 7 • Height measured by SECA wall mounted stadiometer. • Weight measured using a Tanita digital scale (BC-418). • Body composition measured via bio-impedance (Tanita BC-418).
Follow-Up in the CCCEH Mothers enrolled during pregnancy N=702 Children followed to age 5 N=453 N=58 Children followed to age 7 N=371 N=20 follow-up with height and weight data N=331 N=33 N=7 follow-up but height and weight height data not collected.
BMI Percentile At Age 5 Mean percentile = 66th 21% are Obese
BMI Percentile At Age 7 Mean percentile = 71th 25% are Obese Mean % body fat = 24%
Obesity Risk Factors and Anthropometric Outcomes Adjusted for age and gender
Obesity Risk Factors and Anthropometric Outcomes Adjusted for age and gender
Obesity Risk Factors and Anthropometric Outcomes Adjusted for age and gender
Prenatal PAH Exposure and BMI Z-score Adjusted for age, gender, ethnicity, birth weight, maternal obesity and maternal receipt of public assistance
Prenatal PAH Exposure and Percent Body Fat +1.1 Kg fat mass Adjusted for age, gender, ethnicity, birth weight, maternal obesity and maternal receipt of public assistance
Critiques of Analyses Confounding by neighborhood socioeconomic status Confounding by sources of PAH Bias due to loss to follow-up
Defining Neighborhoods: Census Tracts Median Area 0.18 Km2 10th - 90th Percentile Range 0.13 - 0.60 Km2
Defining Neighborhoods: Zip Codes Median Area 3.58 Km2 10th - 90th Percentile Range 1.13 - 7.52 Km2
Defining Neighborhoods: Radial Buffer ½ Mile Radius Median Area 2.03 Km2 10th - 90th Percentile Range 1.58 - 2.03 Km2
Defining Neighborhoods: Network Buffer ½ Mile Distance Median Area 1.23 Km2 10th - 90th Percentile Range 0.81 - 1.37 Km2
Aggregating Census Data to Street Network Buffers • Census data are available by Census block, a polygonal spatial shape. • Census data must be aggregated to neighborhood boundaries.
Assessing Confounding by Neighborhood Socioeconomic Status Median and Interquartile range Neither percent poverty nor median household income predicted PAH levelsor outcomes.
Assessing Confounding by Sources of PAH Predictors of Ambient Air PAH Exposure • Residential ETS exposure: maternal self report of living with a smoker. • Seasonal effects: Air monitoring during “heating season”, period of mandatory heating in apartment buildings, (10/15 – 4/31).. • Street density: Linear Km of streets per Km2 neighborhood area (1 Km radial buffer). • Oil furnaces: Number of oil furnaces burning oil # 4 (0.25 radial buffer).
Assessing Confounding by Sources of PAH Predictors of Ambient Air PAH Exposure Adjusting for ethnicity, receipt of public assistance, and neighborhood poverty rate.
Bias Due to Loss to Follow-up • Use Inverse Probability Weighting to adjust for loss to follow-up and failure to collect data. • Subjects are weighted by the inverse of the probability of successful follow-up/data collection. • Logistic regression model estimates probability of follow-up/data collection conditional on baseline characteristics. • Analyses of outcomes are conducted using marginal models with inverse probability weighting for follow-up/data collection.
Modeling Approach to Calculate Weights • Gender • Ethnicity • Maternal obesity • Birth weight • Public assistance during pregnancy • Maternal education • Maternal satisfaction with living conditions • Neighborhood poverty rate • Neighborhood percent linguistically isolated • Ambient air PAH levels • Indicator variables for subjects missing data on education and satisfaction
Modeling Approach: Age 5 • Gender • Black Ethnicity (+) • Maternal obesity • Birth weight (+) • Public assistance during pregnancy • Maternal education (+) • Maternal satisfaction with living conditions • Neighborhood poverty rate • Neighborhood percent linguistically isolated • Ambient air PAH levels • Indicator variables for subjects missing data on education and satisfaction (-)
Modeling Approach: Age 7 • Gender • Black Ethnicity (+) • Maternal obesity • Birth weight (+) • Public assistance during pregnancy • Maternal education • Maternal satisfaction with living conditions • Neighborhood poverty rate (-) • Neighborhood percent linguistically isolated • Ambient air PAH levels (+) • Indicator variables for subjects missing data on education and satisfaction (-)
Standard Verses IPW Regression Analyses PAH Age 5 Age 7 Exposure Standard IPW Standard IPW Beta BetaBetaBeta 1stTertile ref ref ref ref 2ndTertile 0.26 0.25 0.17 0.28 3rdTertile 0.39* 0.33* 0.30* 0.39* * P<0.05, adjusted for age, gender, ethnicity, birth weight, maternal obesity, receipt of public assistance.
Standard Verses IPW Regression Analyses PAH Age 5 Age 7 Exposure Standard IPW Standard IPW Beta BetaBetaBeta 1stTertile ref ref ref ref 2ndTertile 0.26 0.25 0.17 0.28 3rdTertile 0.39* 0.33* 0.30* 0.39* * P<0.05, adjusted for age, gender, ethnicity, birth weight, maternal obesity, receipt of public assistance.
Prenatal PAH Exposure and BMI Z-score Adjusted for age, gender, ethnicity, birth weight, maternal obesity and maternal receipt of public assistance
Conclusions • Prenatal PAH exposure is associated with higher BMI Z-score at age 5 and 7. • Prenatal PAH exposure is associated with higher percent body fat at age 7. • Findings are robust to control for neighborhood factors and loss to follow-up. • Data are consistent with prior rodent studies. • First data showing that exposure to an environmental pollutant is associated with higher body size.
Collaborators • CCCEH Team • Howard Andrews • Greg Freyer • Lori Hoepner • Darrell Holmes • Frederica Perera • Virginia Rauh • Deliang Tang • Robin Whyatt • BEH Team • Gina Lovasi • Kathryn Neckerman • James Quinn • Danniel Sheehan • Chriss Weiss Funding: NIEHS, EPA, RWJ, NIDDK