Download

1 / 22
220 likes | 414 Vues
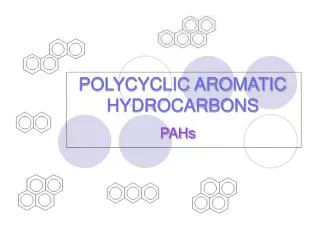
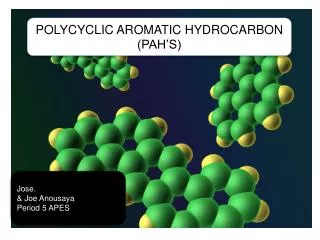
The Presence of Polycyclic Aromatic Hydrocarbons in water. By: Siobhan Shay. What is a PAH?. PAH’s are compounds with multiple aromatic rings They are the result of incomplete combustion of organic substances such as wood, oil, coal and garbage.

E N D
The Presence of Polycyclic Aromatic Hydrocarbons in water By: Siobhan Shay
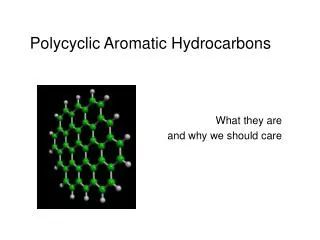
What is a PAH? • PAH’s are compounds with multiple aromatic rings • They are the result of incomplete combustion of organic substances such as wood, oil, coal and garbage. • As they do not dissolve readily in water they are usually found on the surface of water • PAH’s are considered by the health department to be a carcinogen, although not all PAH’s have been classified as such
Naphthalene and Phenanthrene • Naphthalene’s structure: Two benzene rings attached to each other • Phenanthrene’s structure: Three benzene rings attached to each other
Background on the experiment • Samples from the Red Cedar River in Michigan were collected • Samples were tested for the presence of PAH’s using internal standards
The Red Cedar River Flow • The Red Cedar River in Michigan runs through Lansing, East Lansing (MSU Campus), and other surrounding areas • The Red Cedar is approximately 45 miles long • There are 12 tributaries of the Red Cedar
Red Cedar River: History of Pollution • The Red Cedar has a history of pollution dating back many years. • Most recent data has only examined the E. coli levels in the water which have consistently been above standard levels. • The river runs through farmland, urban, and suburban areas • It has a reputation of being one of the “dirtiest” rivers in the Lansing area.
Red Cedar River: History of Pollution • In 2002, there was a study published about pollution in the Red Cedar River in Jackson (Lansing area) and the effects of Johnson Controls Inc, an industrial business • The results were well above acceptable levels of trichloroethylene, a neurotoxin, and Polychlorinated Biphenyls (PBC’s) • They have had a problem with JCI’s pollution since 1985, but have yet (2002) to correct themselves
What is currently being done about pollution? • Because many rivers in Michigan run through industrial and rural areas, there is a great concern about pollution. • To keep track of pollution levels, they have instituted a Watershed Initiative which monitors the levels of pollution in the water (mostly biological)
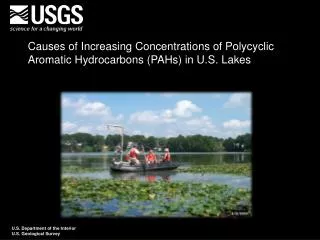
The samples for this experiment were taken in Lansing, where the Red Cedar splits from the Grand River, and also in Williamston, downstream from the industries. Only two samples were taken due to the difficulty to get to the water legally and safely The picture is of the Red Cedar on MSU, and it is very difficult to get a sample Where were the water samples taken?
The Experiment • There was unfortunately no information on the previously detected levels of PAH’s available. • The two PAH’s investigated were Naphthalene, and Phenanthrene • The detection levels in water from previous experiments in other natural water sources were in the parts per billion, so internal standards needed to be used
The maximum absorption of Naphthalene is 270nm In order to prepare a standard curve, a stock solution of 100ppm was made Serial dilutions of 100, 75, 65 and 60 ppm were prepared for analysis. Solutions lower than 60ppm were unreadable because the concentrations were too low to be effectively used. Naphthalene had to be dissolved in acetone, added to water and forced into solution through heating Naphthalene
Naphthalene: The results • For this experiment, 65ppm of a Naphthalene solution was added to each sample • When the unknowns were entered into the standard curve equation, the results were: • Lansing location: 9.1ppm • Williamston location: 9.98ppm • For each of these samples, the amount of Naphthalene (ppm’s) added was subtracted from the final amount
Phenanthrene • Phenanthrene was easier to detect in water. • The lowest concentration for the standard curve we obtained was 25ppm for accurate results • Phenanthrene was dissolved in acetone, added to water, and then forced into solution through heating • The stock solution was 100ppm • The serial dilutions were 100, 75, 50, and 25ppm • The maximum absorption of Phenanthrene is 340pm
Phenanthrene: The results • For these samples, 50ppm of a Phenanthrene solution was added to each sample • The results were: • Lansing location: 20.707ppm • Williamston location: 25.349ppm • For each sample the amount added was subtracted from the final answer
The results continued • There was a pattern established between the two sources: • Water found upstream (Lansing) contained less pollutants than the water found downstream (Williamston) • This agrees with predicted results because there is more opportunity to be contaminated the longer the water travels.
What does this mean? • The results of this experiment was surprising. The levels of the contaminants were much higher than the normal levels of detection • The normal levels of detection are 100-5,000ppb. • Phenanthrene was the most surprising with four to five times the normal range. • Napthalene showed levels closer to the normal ranges, but were still almost twice as high.
What does this mean? • The source of these contaminants are unknown. We do know that the river flows through industrialized areas, and could have been caused by the mishandling of chemical waste from the industrial plants, the accumulation of car exhaust, or the burning of organic materials. • There is know way at this time to determine a definite cause.
Future plans for this experiment • Due to time constraints, I was not able to complete the research as desired. • In the future, it would be ideal to have more water samples from different places along the river. • Also, a larger variety of analytes to investigate, rather than the two, would be ideal. • Finally, the repetition of the experiment to solidify results would be desired.
References • www.msu-water.msu.edu • www.ingham.org • www.atsdr.cdc.gov