Download
1 / 1
10 likes | 142 Vues
Technique. Date. Time. Latitude. Longitude. THE APRIL 14, 2004 JAN MAYEN EARTHQUAKE Mathilde Bøttger Sørensen 1 , Lars Ottemöller 2 , Jens Havskov 1 , Kuvvet Atakan 1 ,

E N D
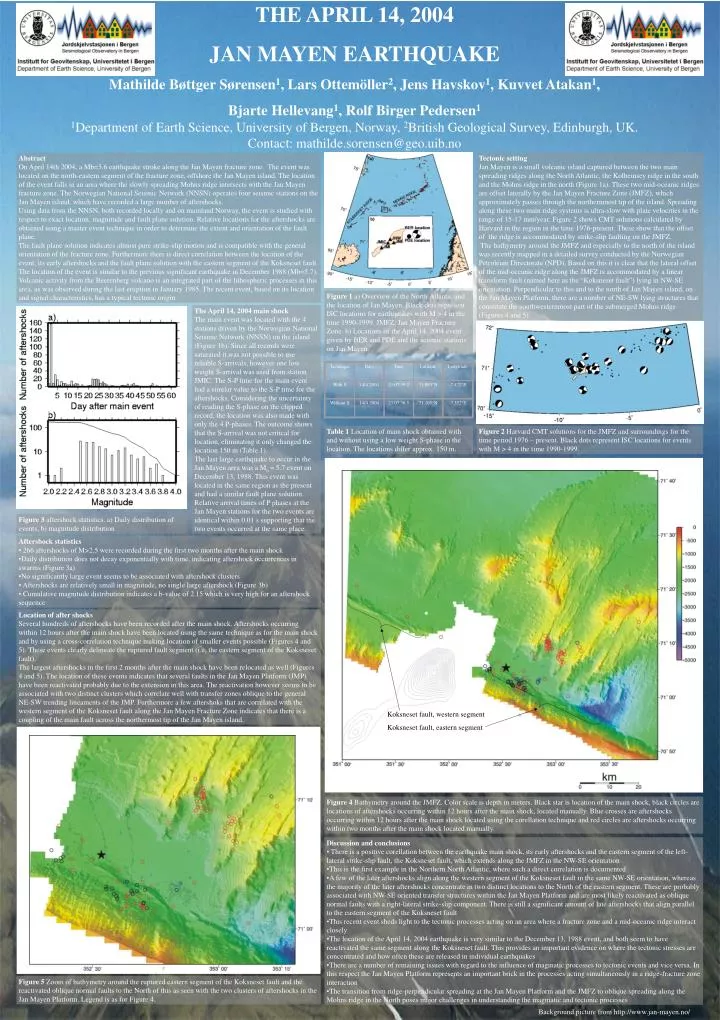
Technique Date Time Latitude Longitude THE APRIL 14, 2004 JAN MAYEN EARTHQUAKEMathilde Bøttger Sørensen1, Lars Ottemöller2, Jens Havskov1, Kuvvet Atakan1, Bjarte Hellevang1, Rolf Birger Pedersen11Department of Earth Science, University of Bergen, Norway, 2British Geological Survey, Edinburgh, UK. Contact: mathilde.sorensen@geo.uib.no With S 14/4 2004 23:07:39.2 71.093N -7.472E Without S 14/4 2004 23:07:38.5 71.105N -7.352E Koksneset fault, western segment Koksneset fault, eastern segment Abstract On April 14th 2004, a Mb=5.6 earthquake stroke along the Jan Mayen fracture zone. The event was located on the north-eastern segment of the fracture zone, offshore the Jan Mayen island. The location of the event falls in an area where the slowly spreading Mohns ridge intersects with the Jan Mayen fracture zone. The Norwegian National Seismic Network (NNSN) operates four seismic stations on the Jan Mayen island, which have recorded a large number of aftershocks. Using data from the NNSN, both recorded locally and on mainland Norway, the event is studied with respect to exact location, magnitude and fault plane solution. Relative locations for the aftershocks are obtained using a master event technique in order to determine the extent and orientation of the fault plane. The fault plane solution indicates almost pure strike-slip motion and is compatible with the general orientation of the fracture zone. Furthermore there is direct correlation between the location of the event, its early aftershocks and the fault plane solution with the eastern segment of the Koksneset fault. The location of the event is similar to the previous significant earthquake in December 1988 (Mb=5.7). Volcanic activity from the Beerenberg volcano is an integrated part of the lithospheric processes in this area, as was observed during the last eruption in January 1985. The recent event, based on its location and signal characteristics, has a typical tectonic origin. Tectonic setting Jan Mayen is a small volcanic island captured between the two main spreading ridges along the North Atlantic, the Kolbeinsey ridge in the south and the Mohns ridge in the north (Figure 1a). These two mid-oceanic ridges are offset laterally by the Jan Mayen Fracture Zone (JMFZ), which approximately passes through the northernmost tip of the island. Spreading along these two main ridge systems is ultra-slow with plate velocities in the range of 15-17 mm/year. Figure 2 shows CMT solutions calculated by Harvard in the region in the time 1976-present. These show that the offset of the ridge is accommodated by strike-slip faulting on the JMFZ. The bathymetry around the JMFZ and especially to the north of the island was recently mapped in a detailed survey conducted by the Norwegian Petroleum Directorate (NPD). Based on this it is clear that the lateral offset of the mid-oceanic ridge along the JMFZ is accommodated by a linear transform fault (named here as the “Koksneset fault”) lying in NW-SE orientation. Perpendicular to this and to the north of Jan Mayen island, on the Jan Mayen Platform, there are a number of NE-SW lying structures that constitute the southwesternmost part of the submerged Mohns ridge (Figures 4 and 5). Figure 1 a) Overview of the North Atlantic and the location of Jan Mayen. Black dots represent ISC locations for earthquakes with M > 4 in the time 1990-1999. JMFZ: Jan Mayen Fracture Zone. b) Locations of the April 14, 2004 event given by BER and PDE and the seismic stations on Jan Mayen. The April 14, 2004 main shock The main event was located with the 4 stations driven by the Norwegian National Seismic Network (NNSN) on the island (Figure 1b). Since all records were saturated it was not possible to use reliable S-arrivals, however one low weight S-arrival was used from station JMIC. The S-P time for the main event had a similar value to the S-P time for the aftershocks. Considering the uncertainty of reading the S-phase on the clipped record, the location was also made with only the 4 P-phases. The outcome shows that the S-arrival was not critical for location, eliminating it only changed the location 150 m (Table 1). The last large earthquake to occur in the Jan Mayen area was a Mb = 5.7 event on December 13, 1988. This event was located in the same region as the present and had a similar fault plane solution. Relative arrival times of P phases at the Jan Mayen stations for the two events are identical within 0.01 s supporting that the two events occurred at the same place. Table 1 Location of main shock obtained with and without using a low weight S-phase in the location. The locations differ approx. 150 m. Figure 2 Harvard CMT solutions for the JMFZ and surroundings for the time period 1976 – present. Black dots represent ISC locations for events with M > 4 in the time 1990-1999. Figure 3 aftershock statistics. a) Daily distribution of events, b) magnitude distribution • Aftershock statistics • 266 aftershocks of M>2.5 were recorded during the first two months after the main shock • Daily distribution does not decay exponentially with time, indicating aftershock occurrences in swarms (Figure 3a) • No significantly large event seems to be associated with aftershock clusters • Aftershocks are relatively small in magnitude, no single large aftershock (Figure 3b) • Cumulative magnitude distribution indicates a b-value of 2.15 which is very high for an aftershock sequence Location of after shocks Several hundreds of aftershocks have been recorded after the main shock. Aftershocks occurring within 12 hours after the main shock have been located using the same technique as for the main shock and by using a cross-correlation technique making location of smaller events possible (Figures 4 and 5). These events clearly delineate the ruptured fault segment (i.e. the eastern segment of the Koksneset fault). The largest aftershocks in the first 2 months after the main shock have been relocated as well (Figures 4 and 5). The location of these events indicates that several faults in the Jan Mayen Platform (JMP) have been reactivated probably due to the extension in this area. The reactivation however seems to be associated with two distinct clusters which correlate well with transfer zones oblique to the general NE-SW trending lineaments of the JMP. Furthermore a few aftershoks that are correlated with the western segment of the Koksneset fault along the Jan Mayen Fracture Zone indicates that there is a coupling of the main fault across the northermost tip of the Jan Mayen island. Figure 4 Bathymetry around the JMFZ. Color scale is depth in meters. Black star is location of the main shock, black circles are locations of aftershocks occurring within 12 hours after the main shock, located manually. Blue crosses are aftershocks occurring within 12 hours after the main shock located using the corellation technique and red circles are aftershocks occurring within two months after the main shock located manually. • Discussion and conclusions • There is a positive corellation between the earthquake main shock, its early aftershocks and the eastern segment of the left-lateral strike-slip fault, the Koksneset fault, which extends along the JMFZ in the NW-SE orientation • This is the first example in the Northern North Atlantic, where such a direct correlation is documented • A few of the later aftershocks align along the western segment of the Koksneset fault in the same NW-SE orientation, whereas the majority of the later aftershocks concentrate in two distinct locations to the North of the eastern segment. These are probably associated with NW-SE oriented transfer structures within the Jan Mayen Platform and are most likely reactivated as oblique normal faults with a right-lateral strike-slip component. There is still a significant amount of late aftershocks that align parallel to the eastern segment of the Koksneset fault • This recent event sheds light to the tectonic processes acting on an area where a fracture zone and a mid-oceanic ridge interact closely • The location of the April 14, 2004 earthquake is very similar to the December 13, 1988 event, and both seem to have reactivated the same segment along the Koksneset fault. This provides an important evidence on where the tectonic stresses are concentrated and how often these are released in individual earthquakes • There are a number of remaining issues with regard to the influence of magmatic processes to tectonic events and vice versa. In this respect the Jan Mayen Platform represents an important brick in the processes acting simultaneously in a ridge-fracture zone interaction • The transition from ridge-perpendicular spreading at the Jan Mayen Platform and the JMFZ to oblique spreading along the Mohns ridge in the North poses major challenges in understanding the magmatic and tectonic processes Figure 5 Zoom of bathymetry around the ruptured eastern segment of the Koksneset fault and the reactivated oblique normal faults to the North of this as seen with the two clusters of aftershocks in the Jan Mayen Platform. Legend is as for Figure 4. Background picture from http://www.jan-mayen.no/


![[PDF] Free Download Afterburn & Aftershock By Sylvia Day](https://cdn4.slideserve.com/8241966/slide1-dt.jpg)
![[PDF] Free Download Afterburn & Aftershock By Sylvia Day](https://cdn4.slideserve.com/8244035/slide1-dt.jpg)