Download
1 / 22
240 likes | 424 Vues
Remote Sensing of Mangrove Deforestation – A Case Study of the Mahakam Delta. Faiz Rahman. MODIS Sinusoidal Tiles Grid. Tiles are 10 degrees by 10 degrees at the equator Each tile for each band of data = 16 MB. Geographic Coordinate. On A Given Day, From Space

E N D
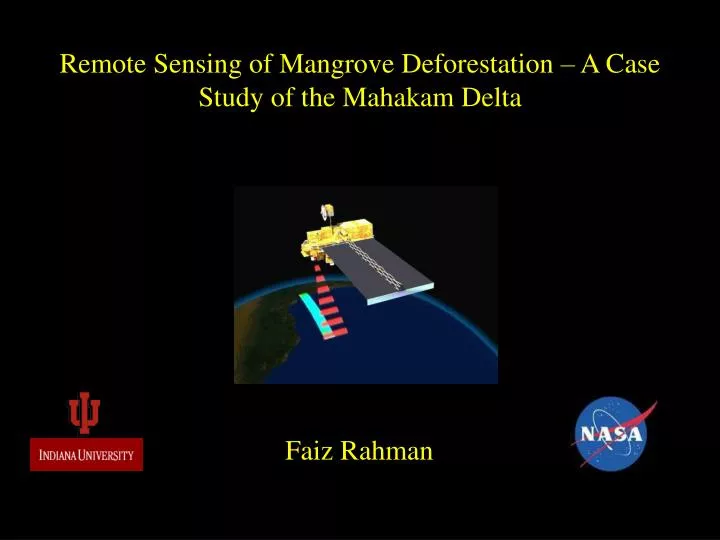
Remote Sensing of Mangrove Deforestation – A Case Study of the Mahakam Delta Faiz Rahman
MODIS Sinusoidal Tiles Grid Tiles are 10 degrees by 10 degrees at the equator Each tile for each band of data = 16 MB
On A Given Day, From Space Kalimantan Looks Like: But Ideal If It Looked Like :
Vegetation Index (VI) VI is a measure of greenness Two or more bands of reflectance are used to calculate a VI NDVI – most used, uses Red and NIR bands, but has limitations EVI – developed to overcome those limitations, it uses Blue band (but scattering and absence are problems) A recent development is EVI2 (Huete et al., 2008). It uses R and NIR, but is robust and does not saturate.
EVI2 in a 3-month Period 0.65 0.05
Change Point Analysis A combined methods of cumulative sum (CUSUM) and bootstrapping If X1, X2,…, X44 represented the consecutive EVI2 values of any pixel, the CUSUM values S0, S1,…, S44 were calculated as: Bootstrapping: the EVI2 time-series (actual dataset) of a pixel was used to generate 1000 synthetic time-series datasets by sampling without replacement, and the CUSUM magnitude of the change was calculated for each of these synthetic datasets.
Some Initial Results For 2000-2010: Unchanged mangrove: 711,981 ha (~61% of the study area) Deforested pre-2000: 86,087 ha (~ 7% of the study area) Deforested since 2000: 279,090 ha (~24% of the study area) *** Regrowth? : 87,944 ha (~8% of the study area)
Edge Effect in Time Series EVI 2 Difference EVI 2 Difference
MODIS Data: Dr. Kamel Didan Data Analysis: Dr. Danilo Dragoni GIS Data, Assistance: Joseph Hutabarat Thank You