Download
1 / 19
190 likes | 272 Vues
Measurements and Uncertainties. Uncertainties and Errors Resolution This is the smallest change in a quantity that can be measured by an instrument. E.g. What is the resolution of a. A 30cm ruler b. An analogue wristwatch c. A thermometer We prefer high resolution instruments:

E N D
Uncertainties and Errors • Resolution • This is the smallest change in a quantity that can be measured by an instrument. • E.g. What is the resolution of • a. A 30cm ruler • b. An analogue wristwatch • c. A thermometer • We prefer high resolution instruments: • A micrometer screw gauge measures to a resolution of 1/100 mm. • A vernier calliper measures to a resolution of 1/10mm.
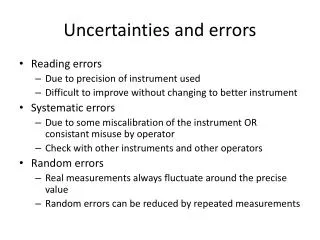
Error and uncertainty An error that is repeated in all readings taken is called a systematic error. Poor instrument calibration leading to a ‘zero error’ is an example of a systematic error. Random errors occur often during repeated experiments, causing the reading to vary above and below the true value. If values have to be estimated, there is often a random error. Q. Which of these two types of errors can be reduced by taking an average of repeated readings?
Precision and Accuracy If repeated measurements always give very similar results, they are precise – they have small random error and low uncertainty. However, this does not mean they are accurate. If repeated measurements are fairly near to the true value, they are accurate– the systematic error is small. However, they may not be precise. Precise but inaccurate Accurate but imprecise
Ruler scale True value • To reduce error: • Always repeat readings if possible. • Take readings at eye level • Use take at least 6 sets of readings • Check for a zero error before starting
Determining Errors and Uncertainties On a single reading, the (+ or -) uncertainty could be considered equal to either the instrument resolution or the human error, depending which is largest. Q. Measure the length of your pen using a ruler. What is a) the uncertainty b) the % uncertainty
If an average reading is calculated from a few readings, the uncertainty equals ½ x the range: E.g. In an experiment a toy car was rolled repeatedly down a ramp in these times… 8.12s, 8.16s, 8.08s, 8.14s, 8.10s Average time = 8.12s, however we are not certain that this is the true value. Range = 8.16 – 8.08 = 0.08 so uncertainty = +/-0.04 Time = 8.12 +/- 0.04 s (Note: With multiple oscillations, when dividing to find T you also divide the absolute uncertainty)
Subtitle Text
Subtitle Text
Subtitle Text
Subtitle Text
Subtitle Text
Subtitle Text