Download
1 / 1
10 likes | 184 Vues
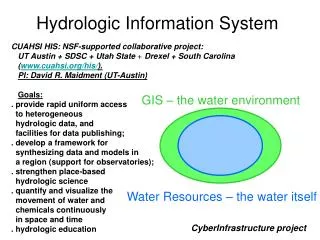
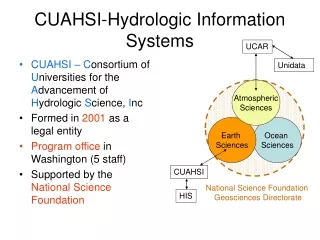
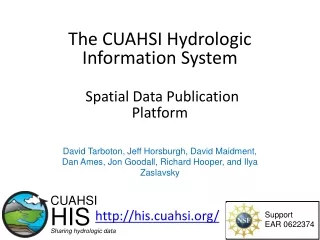
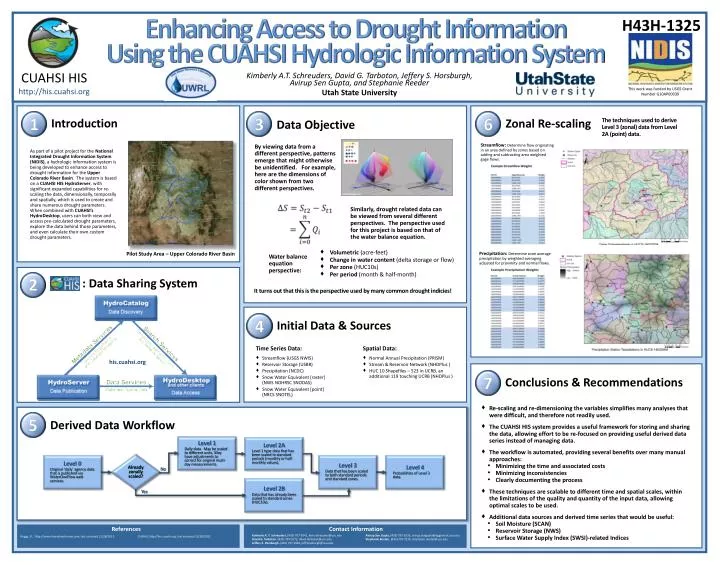
H43H-1325. Enhancing Access to Drought Information Using the CUAHSI Hydrologic Information System. CUAHSI HIS http://his.cuahsi.org. Kimberly A.T. Schreuders, David G. Tarboton, Jeffery S. Horsburgh, Avirup Sen Gupta, and Stephanie Reeder Utah State University.

E N D
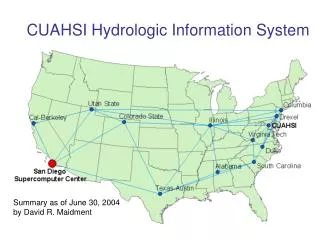
H43H-1325 Enhancing Access to Drought Information Using the CUAHSI Hydrologic Information System CUAHSI HIS http://his.cuahsi.org Kimberly A.T. Schreuders, David G. Tarboton, Jeffery S. Horsburgh, Avirup Sen Gupta, and Stephanie Reeder Utah State University This work was funded by USGS Grant Number G10AP00039 1 3 6 Introduction Zonal Re-scaling Data Objective The techniques used to derive Level 3 (zonal) data from Level 2A (point) data. Streamflow: Determine flow originating in an area defined by zones based on adding and subtracting area weighted gage flows. By viewing data from a different perspective, patterns emerge that might otherwise be unidentified. For example, here are the dimensions of color shown from two different perspectives. As part of a pilot project for the National Integrated Drought Information System (NIDIS), a hydrologic information system is being developed to enhance access to drought information for the Upper Colorado River Basin. The system is based on a CUAHSI HIS HydroServer, with significant expanded capabilities for re-scaling the data, dimensionally, temporally and spatially, which is used to create and share numerous drought parameters. When combined with CUAHSI’s HydroDesktop, users can both view and access pre-calculated drought parameters, explore the data behind those parameters, and even calculate their own custom drought parameters. Similarly, drought related data can be viewed from several different perspectives. The perspective used for this project is based on that of the water balance equation. • Volumetric (acre-feet) • Change in water content (delta storage or flow) • Per zone (HUC10s) • Per period (month & half-month) Pilot Study Area – Upper Colorado River Basin Precipitation: Determine zone average precipitation by weighted averaging adjusted for proximity and normal flows. Water balance equation perspective: 2 : Data Sharing System It turns out that this is the perspective used by many common drought indicies! 4 Initial Data & Sources • Time Series Data: • Streamflow (USGS NWIS) • Reservoir Storage (USBR) • Precipitation (NCDC) • Snow Water Equivalent [raster] (NWS NOHRSC SNODAS) • Snow Water Equivalent [point] (NRCS SNOTEL) • Spatial Data: • Normal Annual Precipitation (PRISM) • Stream & Reservoir Network (NHDPlus ) • HUC 10 Shapefiles – 523 in UCRB, an additional 119 touching UCRB (NHDPlus ) his.cuahsi.org 7 Conclusions & Recommendations • Re-scaling and re-dimensioning the variables simplifies many analyses that were difficult, and therefore not readily used. • The CUAHSI HIS system provides a useful framework for storing and sharing the data, allowing effort to be re-focused on providing useful derived data series instead of managing data. • The workflow is automated, providing several benefits over many manual approaches: • Minimizing the time and associated costs • Minimizing inconsistencies • Clearly documenting the process • These techniques are scalable to different time and spatial scales, within the limitations of the quality and quantity of the input data, allowing optimal scales to be used. • Additional data sources and derived time series that would be useful: • Soil Moisture (SCAN) • Reservoir Storage (NWS) • Surface Water Supply Index (SWSI)-related Indices 5 Derived Data Workflow Level 1 Daily data. May be scaled to different units. May have adjustments to correct for original multi-day measurements. Level 2A Level 1 type data that has been scaled to standard periods (monthly or half-monthly values). Already zonally scaled? Level 0 Original ‘daily’ agency data that is published via WaterOneFlow web services. Level 3 Data that has been scaled to both standard periods and standard zones. Level 4 Probabilities of Level 3 data. No Level 2B Data that has already been scaled to standard zones (HUC10s). Yes References Contact Information Kimberly A. T. Schreuders, (435) 797-2941, kim.schreuders@usu.edu David G. Tarboton, (435) 797-3172, david.tarboton@usu.edu Jeffery S. Horsburgh, (435) 797-2946, jeff.horsburgh@usu.edu Avirup Sen Gupta, (435) 797-3533, avirup.sengupta@aggiemail.usu.edu Stephanie Reeder, (435) 797-7176, stephanie.reeder@usu.edu Briggs, D. , http://www.huevaluechroma.com, last accessed 11/28/2011. CUAHSI, http://his.cuachi.org, last accessed 11/28/2011.