Download
1 / 22
270 likes | 666 Vues
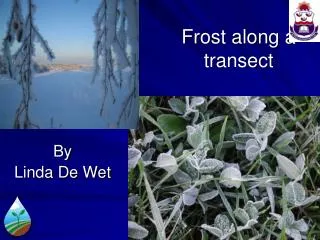
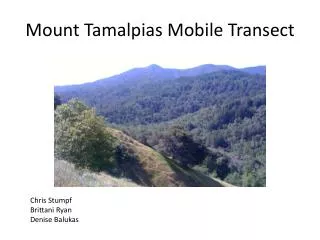
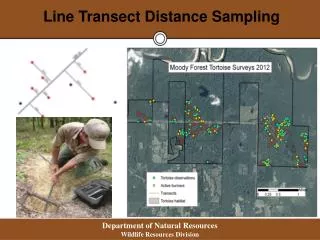
Line transect lecture. Vegetation transects (Offwell, UK). High seas salmon off BC’s Coast. Duck transects along roads (N. Dakota). Example 1: UK Butterfly monitoring scheme. Example 2: Raptor Census - Kyle Elliott (2002) and the Vancouver Natural History Society. Bald eagles.

E N D
Vegetation transects (Offwell, UK) High seas salmon off BC’s Coast Duck transects along roads (N. Dakota)
Example 2: Raptor Census - Kyle Elliott (2002) and the Vancouver Natural History Society Bald eagles Short-eared owls Red-tailed hawks
Q1. Why transects, not always quadrats? Q2. What are potential biases in method?
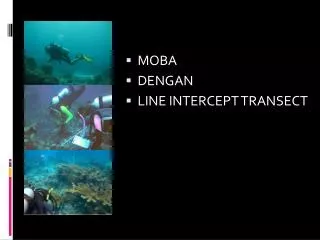
Two general methods (see Krebs) • Distance from random point to organism. • 2. Distance from randomly selected organism to neighbouring organism. 2 1
Two general methods (see Krebs) • Distance from random point to organism. nearest Area of circle (π r 2) contains one individual Inverse of: Density = individuals per unit area r
Two general methods (see Krebs) • Distance from random point to organism. All methods: calculate area per individual for each circle, calculate mean area per indiv., invert = n π sum (r2) r byth-ripley r r
Two general methods (see Krebs) • Distance from random point to organism. If look at third closest organism, we are calculating area per three organisms, or if divide by three, mean area per organism (n = 3). = 3n - 1 π sum (r2) r ordered distance r r
Two general methods (see Krebs) • Distance from random point to organism. • 2. Distance from randomly selected organism to neighbouring organism. 2 1
Two general methods (see Krebs) • 2. Distance from randomly selected organism to neighbouring organism. Area per two individuals, but two circles: cancels out to same π r 2 formula as before r
Two general methods (see Krebs) • 2. Distance from randomly selected organism to neighbouring organism. Area per two individuals, but two circles: cancels out to same π r 2 formula as before r = n π sum (r2) byth-ripley
Two general methods (see Krebs) • 2. Distance from randomly selected organism to neighbouring organism. Problem: how to randomly select first individual? Nearest organism to a random point: BIASED Never selected Frequently selected
WAYS TO RESOLVE PROBLEM: • Mark all organisms with a number, and then randomly select a few. BUT if we could count all organisms, we wouldn’t need a census!
WAYS TO RESOLVE PROBLEM: • Mark all organisms with a number, and then randomly select a few. • Use a random subset of the area (mark organisms in random quadrats). Byth and Ripley
WAYS TO RESOLVE PROBLEM: • Mark all organisms with a number, and then randomly select a few. • Use a random subset of the area (mark organisms in random quadrats). • Use a random point to locate organisms, but then ignore area between it and organism (biased to emptiness). T-square
The 2 snipers Excellent aim, crooked sights Cross-eyed cat, Straight sights
Spatial pattern More uniform More aggregated Random