Download
1 / 59
590 likes | 722 Vues
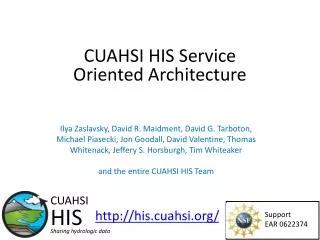
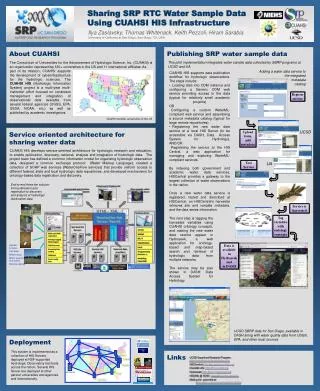
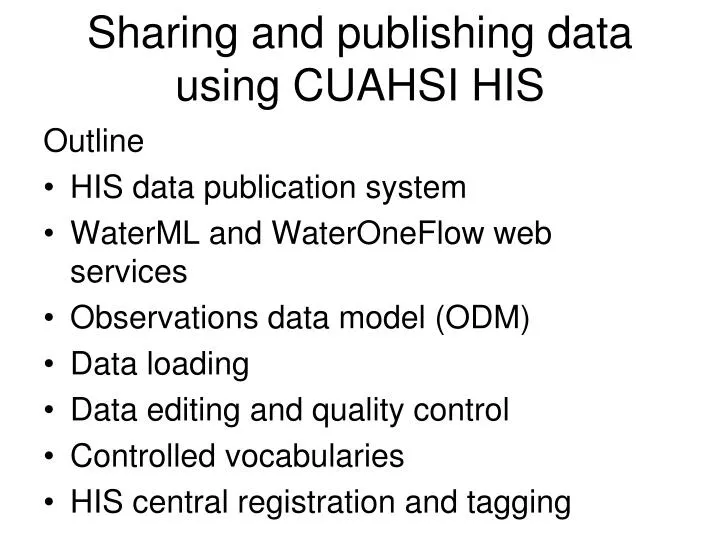
Sharing and publishing data using CUAHSI HIS. Outline HIS data publication system WaterML and WaterOneFlow web services Observations data model (ODM) Data loading Data editing and quality control Controlled vocabularies HIS central registration and tagging. Base Station Computer(s).

E N D
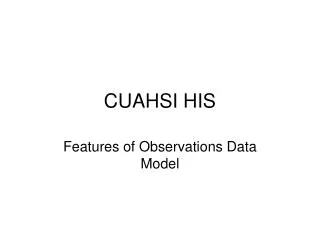
Sharing and publishing data using CUAHSI HIS Outline • HIS data publication system • WaterML and WaterOneFlow web services • Observations data model (ODM) • Data loading • Data editing and quality control • Controlled vocabularies • HIS central registration and tagging
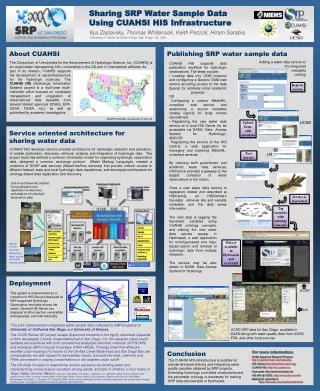
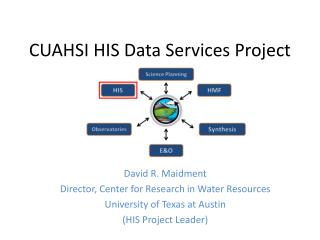
Base Station Computer(s) Telemetry Network Sensors HIS Data Publication System Query, Visualize, and Edit data using ODM Tools Discovery Analysis Access Hydroseek GIS Matlab Splus R IDL HydroExcel HydroGet HydroLink HydroObjects Java C++ VB ODM Database Service Registry Hydrotagger GetSites GetSiteInfo GetVariableInfo GetValues Streaming Data Loader Harvester WaterML WaterOneFlow Web Service ODM Data Loader Water Metadata Catalog ODM Excel Text ODM Contribute your ODM HIS Central
Steps in publishing data • Establish an HIS Server • Load observations into an ODM database • Provide access to data through web services (http://<your-server>/<your-network>/cuahsi_1_0.asmx?WSDL) • Index the resulting water data service at HIS Central (http://hiscentral.cuahsi.org)
Establishing an HIS Server Windows server platform Base Software: Microsoft SQL and ArcGIS Server HIS Server applications WaterOneFlow web services ODM + tools DASH HIS Data http://his.cuahsi.org/hisserver.html
Load Observations into an ODM Database Groundwater levels Streamflow ODM Soil moisture data Precipitation & Climate Water Quality Flux tower data
Outline • HIS data publication system • WaterML and WaterOneFlow web services • Observations data model (ODM) • Data loading • Data editing and quality control • Controlled vocabularies • HIS central registration and tagging
Locations Variables Time WaterML and WaterOneFlow TCEQ Data GetSiteInfo GetVariableInfo GetValues UT Data WaterML Data USGS WaterOneFlow Web Service Data Repositories Client EXTRACT TRANSFORM LOAD WaterML is an XML language for communicating water data WaterOneFlow is a set of web services based on WaterML Slide from David Valentine
WaterOneFlow Web Services Web Application: Data Portal • Your application • Excel, ArcGIS, Matlab • Fortran, C/C++, Visual Basic • Hydrologic model • ……………. • Your operating system • Windows, Unix, Linux, Mac Internet Simple Object Access Protocol Web Services Library Slide from David Valentine
WaterOneFlow Set of query functions Returns data in WaterML NWIS Daily Values (discharge), NWIS Ground Water, NWIS Unit Values (real time), NWIS Instantaneous Irregular Data, EPA STORET, NCDC ASOS, DAYMET, MODIS, NAM12K, USGS SNOTEL, ODM (multiple sites) Slide from David Valentine
WaterML design principles Goal - capture semantics of hydrologic observations discovery and retrieval Role - exchange schema for CUAHSI web services Driven by Hydrologists (community review) ODM USGS NWIS, EPA STORET, Academic Sources Conformance with Open Geospatial Consortium standards. http://www.opengeospatial.org/ For XSD pros, the WaterML schema is athttp://his.cuahsi.org/wofws.html Slide from David Valentine
Point Observations Information Model Utah State University Data Source GetSites Little Bear River Network GetSiteInfo Little Bear River at Mendon Rd Sites GetVariableInfo Dissolved Oxygen Variables GetValues 9.78 mg/L, 1 October 2007, 6PM Values {Value, Time, Qualifier, Offset} • A data source operates and provides data to an observation network • A network is a set of observation sites (stored in a single ODM instance) • A site is a point location where one or more variables are measured • A variable is a measured property (e.g. describing the flow or quality of water) • A value is an observation of a variable at a particular time • A qualifier is a symbol that provides additional information about the value • An offset allows specification of measurements at various depths in water
Building Blocks of WaterML Responses Response Types Key Elements site sourceInfo seriesCatalog variable value queryInfo • -Sites • - Variables • - TimeSeries GetSites GetSiteInfo GetVariableInfo GetValues Slide from David Valentine
Sites response queryInfo name code location site seriesCatalog Series how many variables when TimePeriodType Slide from David Valentine
VariablesResponseType variable – same as in series element Code, name, units Sites Variables Values Slide from David Valentine
GetValues response - timeSeries queryInfo timeSeries sourceInfo – “where” variable – “what” values Sites Variables Values Slide from David Valentine
Values Each time series value recorded in value element Timestamp, plus metadata for the value, recorded in element’s attributes qualifier ISO Time value Slide from David Valentine
Outline • HIS data publication system • WaterML and WaterOneFlow web services • Observations data model (ODM) • Data loading • Data editing and quality control • Controlled vocabularies • HIS central registration and tagging
Why an Observations Data Model • Syntactic heterogeneity (File types and formats) • Semantic heterogeneity • Language for observation attributes (structural) • Language to encode observation attribute values (contextual) • Publishing and sharing research data • Metadata to facilitate unambiguous interpretation • Enhance analysis capability
Scope • Focus on Hydrologic Observations made at a point • Exclude Remote sensing or grid data. These are part of a digital watershed but not suitable for an atomic database model and individual value queries • Primarily store raw observations and simple derived information to get data into its most usable form. • Limit inclusion of extensively synthesized information and model outputs at this stage.
What are the basic attributes to be associated with each single data value and how can these best be organized?
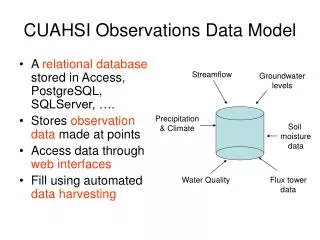
“When” Time, T t A data value vi (s,t) “Where” s Space, S Vi “What” Variables, V CUAHSI Observations Data Model Groundwater levels Streamflow • A relational database at the single observation level (atomic model) • Stores observation data made at points • Metadata for unambiguous interpretation • Traceable heritage from raw measurements to usable information • Standard format for data sharing • Cross dimension retrieval and analysis Precipitation & Climate Soil moisture data Flux tower data Water Quality
CUAHSI Observations Data Model http://www.cuahsi.org/his/odm.html
Site Attributes SiteCode, e.g. NWIS:10109000 SiteName, e.g. Logan River Near Logan, UT Latitude, Longitude Geographic coordinates of site LatLongDatum Spatial reference system of latitude and longitude Elevation_m Elevation of the site VerticalDatum Datum of the site elevation Local X, Local Y Local coordinates of site LocalProjection Spatial reference system of local coordinates PosAccuracy_m Positional Accuracy State, e.g. Utah County, e.g. Cache
Feature Observations Data Model Waterbody Watershed HydroPoint HydroID HydroID HydroID HydroCode HydroCode HydroCode * FType DrainID FType Name AreaSqKm Name AreaSqKm JunctionID JunctionID JunctionID NextDownID * * ComplexEdgeFeature SimpleJunctionFeature HydroEdge HydroJunction HydroJunction HydroJunction 1 HydroID 1 HydroID HydroID HydroID HydroCode HydroCode HydroCode HydroCode ReachCode NextDownID NextDownID NextDownID Name LengthDown LengthDown LengthDown LengthKm HydroNetwork DrainArea DrainArea DrainArea LengthDown FType FType FType FlowDir Enabled Enabled Enabled FType AncillaryRole AncillaryRole AncillaryRole EdgeType Enabled EdgeType Flowline Shoreline Independent of, but can be coupled to Geographic Representation Arc Hydro ODM 1 Sites 1 SiteID SiteCode SiteName OR Latitude Longitude … CouplingTable 1 SiteID HydroID 1
Variable attributes Cubic meters per second Flow m3/s VariableName, e.g. discharge VariableCode, e.g. NWIS:0060 SampleMedium, e.g. water ValueType, e.g. field observation, laboratory sample IsRegular, e.g. Yes for regular or No for intermittent TimeSupport (averaging interval for observation) DataType, e.g. Continuous, Instantaneous, Categorical GeneralCategory, e.g. Climate, Water Quality NoDataValue, e.g. -9999
quantity quantity quantity length or time length or time length or time Scale issues in the interpretation of data The scale triplet a) Extent b) Spacing c) Support From: Blöschl, G., (1996), Scale and Scaling in Hydrology, Habilitationsschrift, Weiner Mitteilungen Wasser Abwasser Gewasser, Wien, 346 p.
(a) spacing too large – noise (aliasing) (b) extent too small – trend (c) support too large – smoothing out The effect of sampling for measurement scales not commensurate with the process scale From: Blöschl, G., (1996), Scale and Scaling in Hydrology, Habilitationsschrift, Weiner Mitteilungen Wasser Abwasser Gewasser, Wien, 346 p.
Data Types • Continuous (Frequent sampling - fine spacing) • Sporadic (Spot sampling - coarse spacing) • Cumulative • Incremental • Average • Maximum • Minimum • Constant over Interval • Categorical
15 min Precipitation from NCDC Incomplete or Inexact daily total occurring. Value is not a true 24-hour amount. One or more periods are missing and/or an accumulated amount has begun but not ended during the daily period.
Offset OffsetValue Distance from a datum or control point at which an observation was made OffsetType defines the type of offset, e.g. distance below water level, distance above ground surface, or distance from bank of river
Daily Average Discharge ExampleDaily Average Discharge Derived from 15 Minute Discharge Data
Methods and Samples Method specifies the method whereby an observation is measured, e.g. Streamflow using a V notch weir, TDS using a Hydrolab, sample collected in auto-sampler SampleID is used for observations based on the laboratory analysis of a physical sample and identifies the sample from which the observation was derived. This keys to a unique LabSampleID (e.g. bottle number) and name and description of the analytical method used by a processing lab.
ValueAccuracy A numeric value that quantifies measurement accuracy defined as the nearness of a measurement to the standard or true value. This may be quantified as an average or root mean square error relative to the true value. Since the true value is not known this may should be estimated based on knowledge of the method and measurement instrument. Accuracy is distinct from precision which quantifies reproducibility, but does not refer to the standard or true value. ValueAccuracy Low Accuracy, but precise Accurate Low Accuracy
Data Quality Qualifier Code and Description provides qualifying information about the observations, e.g. Estimated, Provisional, Derived, Holding time for analysis exceeded QualityControlLevel records the level of quality control that the data has been subjected to.- Level 0. Raw Data - Level 1. Quality Controlled Data - Level 2. Derived Products - Level 3. Interpreted Products - Level 4. Knowledge Products
Series of Observations A “Data Series” is a set of all the observations of a particular variable at a site. The SeriesCatalog is programmatically generated to provide users with the ability to do data discovery (i.e. what data is available and where) without formulating complex queries or hitting the DataValues table which can get very large.
Outline • HIS data publication system • WaterML and WaterOneFlow web services • Observations data model (ODM) • Data loading • Data editing and quality control • Controlled vocabularies • HIS central registration and tagging
Loading data into ODM OD Data Loader • Interactive OD Data Loader (OD Loader) • Loads data from spreadsheets and comma separated tables in simple format • Scheduled Data Loader (SDL) • Loads data from datalogger files on a prescribed schedule. • Interactive configuration • SQL Server Integration Services (SSIS) • Microsoft application accompanying SQL Server useful for programming complex loading or data management functions SDL SSIS
Sensor Network Central Observations Database Applications Observations Database (ODM) Base Station Computer Internet Radio Repeaters Internet ODM Streaming Data Loader Data discovery, visualization, and analysis through Internet enabled applications Remote Monitoring Sites From Jeff Horsburgh
Loading the Little Bear Sensor Data Into ODM ODM Streaming Data Loader Streaming Data Text Files ODM SDL Mapping Wizard • Automate the data loading process via scheduled updates • Map datalogger files to the ODM schema and controlled vocabularies XML Config File ODM SDL Import Application ODM SDL manages the periodic insertion of the streaming data into the ODM database using the mappings stored in the XML configuration file. ODM Base Station Computer(s) From Jeff Horsburgh
6 5 7 4 1 3 2 At last … Work from Out to In And don’t forget … CUAHSI Observations Data Model http://www.cuahsi.org/his/odm.html
Managing Data Within ODM - ODM Tools • Query and export – export data series and metadata • Visualize – plot and summarize data series • Edit – delete, modify, adjust, interpolate, average, etc.
Outline • HIS data publication system • WaterML and WaterOneFlow web services • Observations data model (ODM) • Data loading • Data editing and quality control • Controlled vocabularies • HIS central registration and tagging
Syntactic Heterogeneity Multiple Data Sources With Multiple Formats Excel Files Text Files ODM Observations Database Access Files Data Logger Files From Jeff Horsburgh
Semantic Heterogeneity a United States Geological Survey National Water Information System (http://waterdata.usgs.gov/nwis/). b United States Environmental Protection Agency Storage and Retrieval System (http://www.epa.gov/storet/). c An equivalent to the USGS parameter code does not exist in data retrieved from EPA STORET. From Jeff Horsburgh