Download
1 / 14
140 likes | 324 Vues
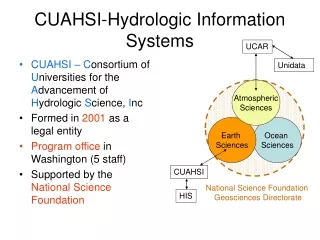
CUAHSI HIS. Features of Observations Data Model. National Server. Workgroup Server. NAWQA. Storet. Observatories. Trends. PI Field Site. NCDC. NCAR. Agency Sites. LTER Sites. Ameriflux. NWIS. CUAHSI Web Services. Excel. Visual Basic. ArcGIS. C/C++. Matlab. Fortran. Access.

E N D
CUAHSI HIS Features of Observations Data Model
National Server Workgroup Server NAWQA Storet Observatories Trends PI Field Site NCDC NCAR Agency Sites LTER Sites Ameriflux NWIS CUAHSI Web Services Excel Visual Basic ArcGIS C/C++ Matlab Fortran Access SAS Some operational services
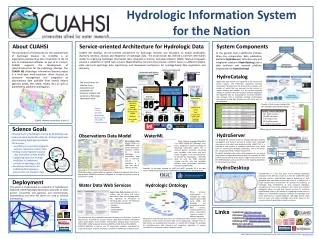
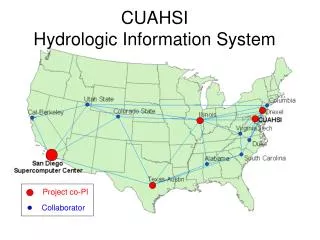
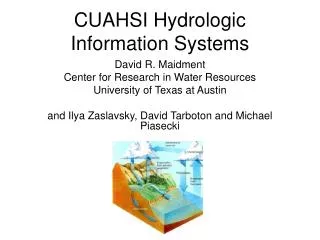
CUAHSI Hydrologic Information System Levels National HIS – San Diego Supercomputer Center Map interface, observations catalogs and web services for national data sources HIS Server Workgroup HIS – research center or academic department Map interface, observations catalogs and web services for regional data sources; observations databases and web services for individual investigator data Personal HIS – an individual hydrologic scientist HIS Analyst Application templates and HydroObjects for direct ingestion of data into analysis environments: Excel, ArcGIS, Matlab, programming languages; MyDB for storage of analysis data
Map front end – ArcGIS Server 9.2 (being programmed by ESRI Water Resources for CUAHSI) Relational database – SQL/Server 2005 or Express Web services library – VB.Net programs accessed as a Web Service Description Language (WSDL) HIS Server Architecture
National and Workgroup HIS National HIS Workgroup HIS National HIS has a polygon in it marking the region of coverage of a workgroup HIS server Workgroup HIS has local observations catalogs for coverage of national data sources in its region. These local catalogs are partitioned from the national observations catalogs. For HIS 1.0 the National and Workgroup HIS servers will not be dynamically connected.
Series and Fields Features Series – ordered sequence of numbers Point, line, area, volume Discrete space representation Time series – indexed by time Frequency series – indexed by frequency Surfaces Fields – multidimensional arrays Continuous space representation Scalar fields – single value at each location Vector fields – magnitude and direction Random fields – probability distribution
Data Types Hydrologic Observation Data Geospatial Data (GIS) (Relational database) Digital Watershed Weather and Climate Data Remote Sensing Data (NetCDF) (EOS-HDF) http://www.cuahsi.org/his/documentation.html
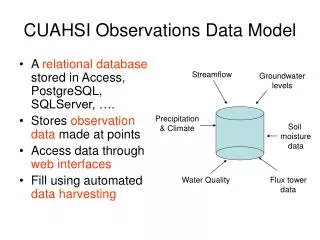
Point Observations Information Model USGS Data Source Streamflow gages Network Neuse River near Clayton, NC Sites ObservationSeries Discharge, stage, start, end (Daily or instantaneous) Values 206 cfs, 13 August 2006 {Value, Time, Qualifier} • A data source operates an observation network • A network is a set of observation sites • A site is a point location where one or more variables are measured • A variable is a property describing the flow or quality of water • An observation series is an array of observations at a given site, for a given variable, with start time and end time • A value is an observation of a variable at a particular time • A qualifier is a symbol that provides additional information about the value
Value Site Date-Time Offsets Censor Qualifier Method Source Sample Derived From Quality Control Level ODM Value Data Table
Qualifiers • Censor: Censored values (<, >) • Qualifiers: E, etc.
Quality Control Levels • 0: Raw Data as measured • 1: Quality Controlled data subject to “std” QC procedure • 2: Derived Product scientific/technical interpretation, including multisensor products (e.g., averages) • 3: Interpreted Products model-based interpretation, using other data, strong prior assumpations (e.g., radar precipitation, fluxes) • 4: Knowledge Products model-based, multidisciplinary, less standard, stronger assumptions (e.g., old/new water interpretations based on stable isotopes)
Geomorphologist Biogeochemist Aquatic Ecologist Glaciated Valley DOCQuality? Perifluvial Oligotrophic? Carbon source? Hyporheic exchange? Backwater habitat Redox Zones? Substrate Size, Stability? Benthic Community Thalweg? Mineralogy? Chemistry? Well sorted? Abstractions in Modeling Real World “Digital Environment” DNA Sequences Water quantity and quality Meteorology Hydrologist Remote sensing Vegetation Survey Conceptual Frameworks Snowmelt Processes? Groundwater Contribution? Physical World Model Representations -Mathematical Formulae -Solution Techniques Geographically Referenced Mapping Q, Gradient, Roughness? Data Representation • Theory/Process Knowledge • Perceptions of this place • Intuition Validation Wetted Perimeter Measurements