Download
1 / 23
240 likes | 340 Vues
Application of geographic information to estimate small scale air pollution exposure. Paul Fischer. Content. How do we build an air pollution exposure map based on geographic information ? Example of the application of these maps in health studies (air pollution epidemiology)

E N D
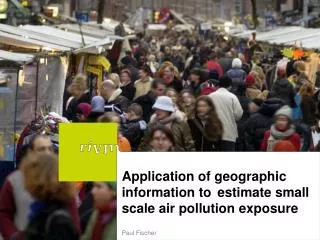
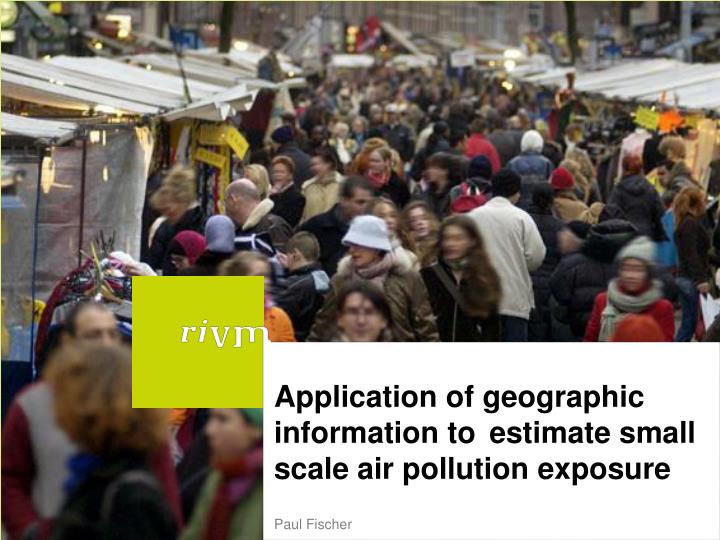
Application of geographic information to estimate small scale air pollution exposure Paul Fischer
Content • How do we build an air pollution exposure map based on geographic information ? • Example of the application of these maps in health studies (air pollution epidemiology) • Example of the application of these maps to describe population air pollution exposure • Conclusions EUROHEIS2 Workshop Utrecht 5-3-2009
What exposure ? Common in air pollution epidemiology: • Usually data of existing measurement site (RIVM) • Site in city or country (regional background) • Applied to all participants in the study • Problem: misclassification due to ignorance of spatial variation EUROHEIS2 Workshop Utrecht 5-3-2009
Better measures • Internal exposure per individual (ideally) • Derived measure: estimated or measured personal exposure (but can be very labor intensive and expensive) • Compromise with GIS to account for: • Spatial variability • Individual exposures EUROHEIS2 Workshop Utrecht 5-3-2009
Estimation with GIS • Principle: • produce an air pollution exposure map with a high spatial resolution • project the participant (x-y coordinate) in this exposure map (Mapping) • Home address, school address, day-care centre, working address, etc. EUROHEIS2 Workshop Utrecht 5-3-2009
How do I produce an air pollution map ? • Spatial interpolation • Uses statistical methods to model a pollution map, based on measurement sites • Dispersion modelling • Estimates air pollution on the basis of traffic volumes/composition, speed, emission factors, street characteristics and meteorology • However, both methods are not useful in urban areas ! EUROHEIS2 Workshop Utrecht 5-3-2009
Land Use Regression (LUR) • Combines measured concentrations with covariate data to predict air pollution levels at unmeasured locations • Association between dependant variable (air pollution level) and predictor variables on measured locations is analyzed by regression • The regression model can be used to predict concentrations at locations where no measurements are available Elements of a land use regression model showing monitoring locations for pollutant as the dependent variable and land use characteristics within buffers as the predictor variables. (Jerrett et al, J. Exp Ana Env Epi, 2005) EUROHEIS2 Workshop Utrecht 5-3-2009
Application in our health study • Study in Amsterdam (SAVIAH) • EU-funded; Huddersfield, Poznan, Prague • Developing methodology • Assessing the association between personal exposure to traffic related air pollution and airway symptoms EUROHEIS2 Workshop Utrecht 5-3-2009
Application in our health study • First step: creating the air pollution map • Chosen for NO2 map • Good indicator for traffic related air pollution, easy to measure • Better: PM2.5, soot, particle number • for each child the address was projected on the map • then, for each child the personal exposure was estimated EUROHEIS2 Workshop Utrecht 5-3-2009
The yellow dots represent the homes of the participating children. Our aim is to estimate the NO2 level for every home address, but also for the area around the home address. In fact, we want to know the NO2 level at every point in the map. EUROHEIS2 Workshop Utrecht 5-3-2009
This is a busy crossing and NO2 level is high Further down is a quiet street with low NO2 level Measurement sites. Size of dot represents level of measured NO2
Road density Distance to Building nearest road density d å d å min( ) Area characteristics EUROHEIS2 Workshop Utrecht 5-3-2009
Nassaukade Lage luchtverontreiniging Watergraafsmeer Hoge luchtverontreiniging Wiboutstraat Ring Amsterdam EUROHEIS2 Workshop Utrecht 5-3-2009
Second application: describing exposures distributions Why ? • Knowing who is exposed helpful for effective health policy Answers on questions like: • Where are measures most necessary ? • Are some groups higher exposed than others ? • Environmental (in)justice ? Is exposure equally distributed ? EUROHEIS2 Workshop Utrecht 5-3-2009
Method • NO2 and PM10 maps for The Netherlands • CBS for 2004: 6 digit postal code (CBS, Voorburg 2006) • About 400000 6PC areas • On average about 20 houses EUROHEIS2 Workshop Utrecht 5-3-2009
Per 6 position postal code PM10 en NO2 at centroide determined • (also possible at address x-y coordinate) • Assessed distribution of PM10 and NO2 for CBS characteristics EUROHEIS2 Workshop Utrecht 5-3-2009
Conclusies and possible input for discussion: • GEO information can be used for development of exposure maps in environmental health studies • GIS is a practical technique to predict individual exposure in (epidemiologic) research • GEO information can be used to provide information about exposure distributions in populations • This information can be used for environmental policy EUROHEIS2 Workshop Utrecht 5-3-2009