Download
1 / 53
530 likes | 620 Vues
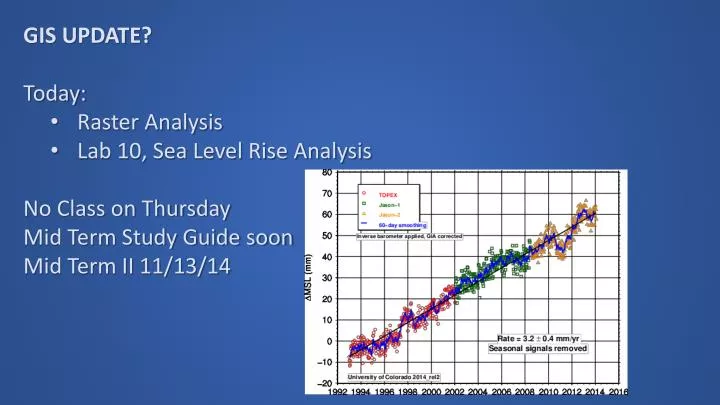
GIS UPDATE? Today: Raster Analysis Lab 10, Sea Level Rise Analysis No Class on Thursday Mid Term Study Guide soon Mid Term II 11/13/14. Raster Analysis. Raster math Statistics: min, max, mean, std. dev. Local, Neighborhood, Zonal Distance (cost) Topography: Slope, aspect, contours

E N D
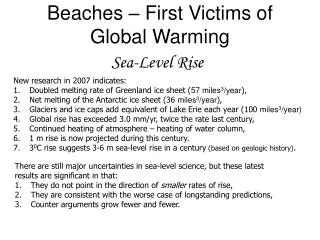
GIS UPDATE? • Today: • Raster Analysis • Lab 10, Sea Level Rise Analysis • No Class on Thursday • Mid Term Study Guide soon • Mid Term II 11/13/14
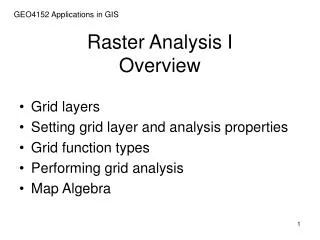
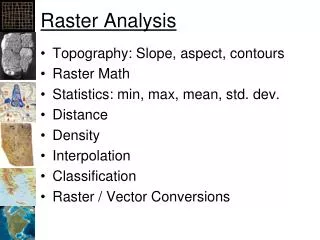
Raster Analysis Raster math Statistics: min, max, mean, std. dev. Local, Neighborhood, Zonal Distance (cost) Topography: Slope, aspect, contours Reclassify Raster / Vector Conversions Originally Developed by James Graham, modified by J. R. Patton
Raster Data Model Uses grid cells of a given dimension to represent the value or attribute of a real world entity or phenomenon
The value may be a measurement or a code. Cell values are numeric: can be either positive or negative, integer, or floating point.
Images: True Color Composite (multi-band raster data set; 3 raster layers; 1 each for RGB) Spectral Reflectance
ArcGIS Data Types * ArcGIS documentation indicates the GRID values are always stored as 32-bit values See: http://www.esri.com/news/arcuser/1002/files/table_2.pdf, http://webhelp.esri.com/arcgisdesktop/9.3/index.cfm?TopicName=Bit_depth_capacity_for_raster_dataset_cells, http://webhelp.esri.com/arcgisdesktop/9.3/index.cfm?topicname=Technical_specifications_for_raster_dataset_formats
Computer-Based Numeric Data Types See: http://en.wikipedia.org/wiki/Integer_overflow, http://steve.hollasch.net/cgindex/coding/ieeefloat.html
Dana Tomlin and Joseph Berry (1970’s) A method of treating individual raster layers as members of algebraic expressions 2 * LayerA
LayerA + LayerB Arithmetic Operators (+, -, *, /) Mathematical Functions (Sqr, Sqrt, Log, Abs, exp, int, etc.) Comparison Operators (>, >=, =, <>, <, <=) Boolean Operators (AND, OR, NOT, XOR)
Toolbox → Spatial Analysis Tools → Map Algebra → Raster Calculator
= -
Local: Arithmetic: +,-,/, *, MOD (Modulo): returns the remainder Boolean: OR: If either input is true, output is true AND: If both inputs are true, output is true CON (Conditional)
Abs (absolute): flips negatives to positive • Ceil (ceiling): float to integer next highest integer value (i.e. 1.1 -> 2) • Floor: float to integer giving next lowest integer value (i.e. 1.1 -> 1) • Int (integer): truncates float to integer
<> (Not Equals) • == (Equals) • < (Less than) • <= (Less than or equal to) • > (Greater than) • >= (Greater than or equal to)
Raster Math: Boolean AND 0 AND 1 = 0 = AND “AND” works but the calculator will insert “&”
Raster Math: Boolean OR 0 OR 1 = 1 = OR “OR” works but the calculator will insert “!”
Map Algebra Examples: Fire Hazard: [Fuel Density Hazard] + [Slope Hazard] + [Veg Type Hazard] Probability of encountering the cascade treefrog (Litoriapearsoniana) within the forests of eastern Australia: 1 / (1 + exp(10.48 – 2.204 * log10(RAINFALL) – 2.037 * PALMS)) RAINFALL= the annual volume of rain falling in the watershed above the stream PALMS = 1 if palms are present at the site and 0 otherwise.
Raster Analysis: reclass Identifying suitable habitat South facing slopes aspect between 150 and 200 degrees. Slope < 20 degrees Green = suitable slope (cell value = 1) Red = unsuitable slope (cell value = 0) Green = suitable aspect (cell value = 1) Red = unsuitable aspect (cell value = 0)
Identify Slope < 20 degrees (Alternative method) “Slope” < 20
“suitable aspect” * “suitable slope” suitable_habitat
Cell value = 1… Suitable slope & Suitable aspect = *
“No-Data” or NULL Values • Rasters are always rectangular • No-Data values are “transparent” and are not used for calculations
Land cover Digital Elevation Model (DEM)
Raster Sources • Scanned • Topos • Remotely Sensed • Aerial Photos • Satellite Photos • Digital Elevation Models (DEM) • Derived Rasters • Hill shade • Slope • Aspect • Statistical Spatial Analysis
Digital Elevation Model (DEM) Each pixel value is an elevation
Digital Orthophoto Quarter Quad (DOQQ) 1 meter aerial photos
7 Bands • 30m, 15m bw • Entire earth LandSat • Twice a month • 26 years of coverage • “Free” • EROS Data Center
National Land Cover Dataset (NLCD) Based on Landsat Imagery 21 Classes based on cover type
1992 2006 2001
Derived Rasters • Land Cover from satellite and aerial • Topography: Slope, aspect, hillshade • Ecoregions • Suitable Habitat • Flood plains • Geological Regions
GeoReferenced File Formats • GRID: ESRI’s format • GeoTIFF: Excellent support • MrSID: LizardTech • IMG: ERDAS • ECW: ERMapper • BIL, BIP, BSQ: See header • “ASCII” or “GRID ASCII” (asc) • Lots of others…
Conversions • Raster to Point: • Raster to Point • Raster to Polyline: • Countour • Streams • Raster to Polyline • Raster to Polygon: • Viewsheds • Watershed • Raster to Polygon • Point to Raster • Interpolation • Density • Point to Raster • Polyline to Raster • Polyline to Raster • Polygon to Raster • Polygon to Raster
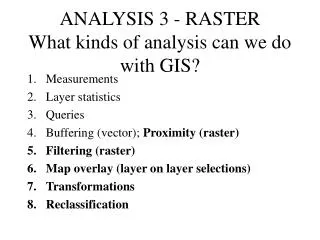
Raster Analysis • Raster math • Statistics: min, max, mean, std. dev. • Local, Neighborhood, Zonal • Distance (cost) • Topography: Slope, aspect, contours • Reclassify • Raster / Vector Conversions
Raster Statistics • Local • Operate on one pixel in each raster • Neighborhood (or Focal) • Operate on a few pixels around each pixel • Zonal • Collection of regions • Region is a contiguous area of the same pixel values • Global • Operate on the “whole” raster
Local Stats • “Cell Statistics” computes stats on all the values for a pixel in a multi-band raster. • Example for “Sum”: Esri ArcGIS 10 Help
Neighborhood (or Focal) Columns • Result=Operation on pixels nearby Rows
Focal Statistics • Computes stats on pixels around an existing pixel • Example for Sum: Esri ArcGIS 10 Help
Zonal Statistics • Computes statistics for defined regions (features) • Tools: • Zonal Statistics: • Outputs a raster (not sure of the value) • Zonal Statistics as Table: • Outputs a table • Used to compute all kinds of valuable things: • Percent land cover • Percent impervious cover • Percent water below a certain depth • Etc.
Zonal Statistics Zone Layer Value layer Output layer (or table) Esri ArcGIS 10 Help
Conditional Operator • Con(<condition>,<true>,<false>) • Given a raster “condition”: • Puts the true value where true and false value where false Con!
Elevations over 3000 meters • Con("W100N40.DEM“>3000,0,1)
Mosaic Rasters • Data Management Tools -> Raster -> Raster Dataset -> Mosaic to new Raster