Download
1 / 22
230 likes | 394 Vues
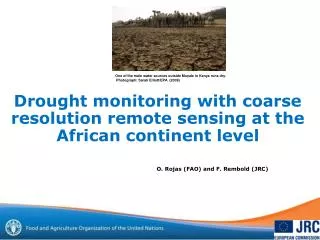
One of the main water sources outside Moyale in Kenya runs dry. Photograph: Sarah Elliott/EPA (2009). Drought monitoring with coarse resolution remote sensing at the African continent level. O. Rojas (FAO) and F. Rembold (JRC). Problem

E N D
One of the main water sources outside Moyale in Kenya runs dry. Photograph: Sarah Elliott/EPA (2009) Drought monitoring with coarse resolution remote sensing at the African continent level O. Rojas (FAO) and F. Rembold (JRC)
Problem • Currently weather stations are sparse and provide discontinuous data • Rainfall estimates have a bias and show deviations in different regions of Africa (Dinku et al. 2007, Lim and Ho 2000). Objective • The objective of the present study is to use the vegetation index derived from NOAA-AVHRR to calculate the probability of agricultural drought occurrence
Data • Vegetation Health Index (VHI) produced by the Center for Satellite Applications and Research (STAR) of the National Environmental Satellite, Data and Information Service (NESDIS) (1981-2009). Weekly product, 16 km resolution. • Normalized Difference Vegetation Index (NDVI) dataset from the NASA Global Inventory Monitoring and Modeling Systems (GIMMS) group. 15-day MVC, 8 km resolution. (1981-2006) • A crop mask. The crop mask was constructed using FAO crop zones for 10 crops, and the Global Land Cover (GLC2000) • The first sub-national administrative units from the Global Administrative Unit Layers (GAUL) database.
PERIOD OF ANALYSIS 28 YEARS VHI (1981-2010) Weekly data 16 km resolution GIMMS NDVI (1981-2006) 15-day data 8 km resolution Phenological-model (Average SOS and GFS) 30 VHI crop season average images Administrative regions (GAUL) Agricultural crop mask (FAO crop zones x GLC2000) 30 Sub-national maps with the percentage of agriculture area affected by drought VHI < 35 Empirical probabilities at Sub-national level of having 30% and 50% of agriculture area affected by drought Input data Process and tools Intermediate and final outputs
VHIi = a VCIi + b TCIi http://www.star.nesdis.noaa.gov/smcd/emb/vci/VH/vh_ftp.php VCIi = 100 * (NDVIi – NDVImin)/(NDVImax – NDVImin) TCIi = 100 * (Tmax – Ti)/(Tmax – Tmin)
Source: Kogan, F. 1995. Droughts of the late 1980s in the United States as derived from NOAA polar-orbiting satellite data. Bulletin of the American Meteorological Society vol.76, No. 5 655-668 pp.
Period of analysis Source: White, M.; Thornton, P. and Running, S. 1997. A continental phenology model for monitoring vegetation responses to interannual climatic variability, Global Biogeochemical Cycles 11 (2) 217-234
A B C Crop mask, SOS and EGF Figure 2. (a) Agricultural crop mask considering the main FAO crop zones and masking out the forest using GLC2000 for the following annual crops: pulses, sorghum, wheat, millet, maize, niebe, teff, yams, rice and barley. (b) The start of crop development stage (c) end of the grain filling stage.
From VHI to % of agricultural area affected by drought at sub-national level temporal aggregation + spatial aggregation • The method does not depend on rainfall (-estimates). • Considers time and space dimensions of drought • Good agreement with station level indices such as SWALIM’s CDI
Drought probability • First crop season • Second crop season In Somalia probability > 35% to have 30% of agricultural area affected by drought in the first crop season and > 30% to have 50% affected in the second season!
Area affected by drought (VHI<35) at different scales of analysis
Eastern Africa Week 33, 21 August 2011 A Week 35, 4 September 2011 B C D (A) Start of the crop development stage by administrative unit (B) Agricultural areas (C) Percentage of the agriculture areas with Vegetation Health Index (VHI) below 35 for the cropping season 2011/2012 (D) Enlarge area of (C) in Eastern Africa, VHI is temporally average.
1984 1989 1996 2000 2008 1999 Drought and La Niña in Eastern Africa Percentage of agriculture areas affected by drought for each cropping season when La Niña occurred. 2011 (up-dated until 1st dekad of July) 2009
Eastern Africa 2011/2012 1992/93
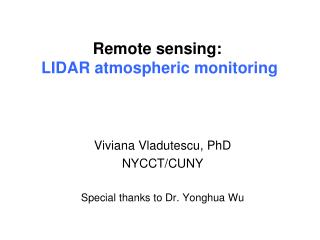
Drought monitoring with VHI in near real time • Going from average Land Surface Phenological date to near real time analysis at pixel level • Automatic determination of seasonality, number of growing seasons per year, and growing season breakpoints using Autocorrelation • LSP (Land Surface Phenology) parameters retrieval using model fit. Original FAPAR time series Autocorrelation 2 GS per year Double Hyperbolic Tangent model fitted to original data Work in progress with M. Meroni, M.M. Verstraete, O. Rojas
Drought monitoring with VHI in near real time 1 Start of GS • Determination of phenological parameters • Start of GS • End of GS • GS length • Accumulated fAPAR • Anomalies • .. (Sep-Dec 2010) (Mar-Jun 2011)
Some advantages & limitations • The validity of the VHI as drought detection tools relies on the assumption that NDVI and LST (land surface temperature) at a given pixel will vary inversely over time, with variations in VCI and TCI driven by local moisture conditions. • This assumption will be valid when water-not energy-is the primary factor limiting vegetation growth (highlands Ethiopia, South Africa-wheat areas) • NDVI values may slightly vary due to soil humidity and depending on the particular anisotropy of the target (angular geometry and time of measurement) • AVHRR is composed by data from several different NOAA satellites
Some advantages & limitations • AVHRR has the longest time series, offers a thermal channel and data is available for downloading on the Web in near real time • The method presented has the advantage to detected agricultural droughts (inter-annual analysis based on the crop cycle duration, restricted to the agricultural areas of the administrative division) • The approach is better understood by the general users due to the crop cycle integration of the results compared with other RS indicators like for example ten-daily NDVI differences
Questions & discussion ROJAS, O., VRIELING, A. REMBOLD, F. (2011) Assessing drought probability for agricultural areas in Africa with coarse resolution remote sensing imagery. Remote Sensing of Environment 115 (2011) 343-352