Download

1 / 41
690 likes | 1.36k Vues
Chapter 10: Phase Diagrams and Microstructures. Temperature vs. composition behavior of the various alloy constitutes the phases. Allows design and control of heat treatment by controlling equilibrium and non-equilibrium structure.

E N D
Chapter 10: Phase Diagrams and Microstructures • Temperature vs. composition behavior of the various • alloy constitutes the phases. • Allows design and control of heat treatment by controlling • equilibrium and non-equilibrium structure. • Structure(phases and microstructure) often controls properties • of materials, and, therefore, depends on thermal history. • Objectives: • Read and evaluate phases present at T. • Determine composition of phases and phase fraction. • Know difference between types of reactions, e.g., eutectic, eutectoid, proeutectoid. • Make a schematic diagram of microstructure.
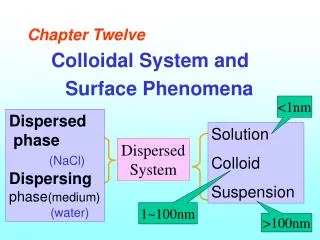
Phase B Phase A Nickel atom Copper atom Phase Diagrams: Issues to Address • When we combine two elements, what equilibrium state do we get? • In particular, if we specify... --a composition (e.g., wt%A - wt%B), and --a temperature (T) then... How many phases do we get? What is the composition of each phase? How much of each phase do we get? Ordered Phase Solid-solution Phase
Example Phase (T-c) Diagram : Cu-Zn • Solution – solid, liquid, or gas solutions, single phase • Mixture – more than one phase liquid bcc-ss fcc-ss 2-phase hcp-ss hcp bcc CsCl
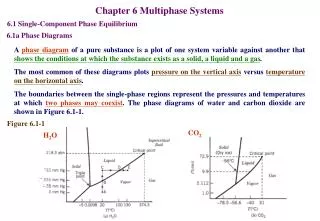
Sugar/Water Phase Diagram 10 0 Solubility L Limit 8 0 (liquid) 6 0 + L Temperature (°C) S (liquid solution 4 0 i.e., syrup) (solid 20 sugar) 0 20 40 60 80 100 C = Composition (wt% sugar) Sugar Water Solubility Limit in Phase Diagram • Solubility Limit: Max concentration for which only a solution occurs. • Ex: Water-Sugar Q: What is solubility limit at 20oC? Answer: 65wt% sugar. If Co < 65wt% sugar:syrup If Co > 65wt% sugar:syrup + sugar. Adapted from Fig. 10.1, Callister & Rethwisch 3e. • Solubility limit increases with T: e.g., if T = 100C, solubility limit = 80wt% sugar.
Components and Phases • Components: elements or compounds that are mixed initially (e.g., Al and Cu) • Phases: physically and chemically distinct material regions that result (e.g., a and b). Aluminum-Copper Alloy Adapted from chapter-opening photograph, Chapter 9, Callister, Materials Science & Engineering: An Introduction, 3e.
B(100°C,C = 70) 1 phase D(100°C,C = 90) 2 phases 100 L 80 (liquid) + 60 L S Temperature (°C) ( liquid solution (solid 40 i.e., syrup) sugar) A(20°C,C = 70) 2 phases 20 0 0 20 40 60 70 80 100 C = Composition (wt% sugar) Temperature (T) and Composition (C) Effects • Changing T can change # of phases: path A to B. • Changing Co can change # of phases: path B to D. water- sugar system Adapted from Fig. 10.1, Callister & Rethwisch 3e.
Criteria for Solid Solubility: recall Hume-Rothery rules Simple system (e.g., Ni-Cu solution) • Both have the same crystal structure (FCC) and have similar electronegativities and atomic radii (W. Hume – Rothery rules) suggesting high mutual solubility. • Ni and Cu are totally soluble in one another for all proportions.
T(°C) • 2 phases: 1600 (liquid) 1500 L (liquid) (FCC solid solution) • 3 phase fields: 1400 L a liquidus + 1300 L + a L solidus a a 1200 (FCC solid 1100 solution) 1000 wt% Ni 0 20 40 60 80 100 Cu-NiPhase Diagram: T vs. c (wt% or at%) • Tell us about phases as function of T, Co, P. • For this course: --binary systems: just 2 components. --independent variables: T and Co (P = 1atm is always used). -- isomorphous i.e., complete solubility of one component in another; a phase field extends from 0 to 100 wt% Ni. Adapted from Fig. 10.3(a), Callister & Rethwisch 3e. (Fig. 10.3(a) is adapted from Phase Diagrams of Binary Nickel Alloys, P. Nash (Ed.), ASM International, Materials Park, OH (1991).
T(°C) 1600 1500 L (liquid) 1 phase: a B (1250°C, 35 wt% Ni): (1250°C,35) 1400 liquidus 2 phases: L + a a + 1300 solidus L B a (FCC solidsolution) 1200 A(1100°C,60) 1100 1000 wt% Ni 0 20 40 60 80 100 Phase Diagrams: # and types of phases • Rule 1: If we know T and Co, then we know: --the # and types of phases present. • Examples: Cu-Ni phase diagram A(1100°C, 60 wt% Ni):
Cu-Ni system T(°C) A TA tie line liquidus L (liquid) At TA = 1320°C: 1300 a + L Only Liquid (L) present B TB solidus CL = C0 ( = 35 wt% Ni) a a At TD = 1190°C: + L (solid) 1200 D Only Solid (a) present TD C = C0 ( = 35 wt% Ni) 32 35 4 3 20 30 40 50 At TB = 1250°C: CL C0 C wt% Ni Both and L present CL = C ( = 32 wt% Ni) liquidus C = C ( = 43 wt% Ni) solidus Phase Diagrams: composition of phases • Rule 2: If we know T and Co, then we know: --the composition of each phase. • Examples: Consider C0 = 35 wt% Ni
Cu-Ni system T(°C) A TA liquidus tie line L (liquid) At TA : Only Liquid (L) present 1300 a + L B WL= 1.00, Wa = 0 TB solidus At TD : Only Solid ( ) present S R a a + WL = 0, W = 1.00 L a (solid) 1200 D TD At TB : Both and L present 32 35 4 3 20 3 0 4 0 5 0 S = WL CL C0 Ca wt% Ni R + S R = = 0.27 Wa R + S Phase Diagrams: wt. fraction of phases • Rule 3: If we know T and C0, then can determine: -- the weight fraction of each phase. • Examples: Consider C0 = 35 wt% Ni W = wt. fraction of phase out of whole.
T(°C) tie line liquidus L (liquid) 1300 a + L B solidus T B a a + L (solid) 1200 S R 20 3 0 4 0 5 0 C0 CL C wt% Ni The Lever Rule • Sum of weight fractions: • Conservation of mass (Ni): • Combine above equations:
T(°C) tie line liquidus L (liquid) 1300 a + M ML L B solidus T B a a + L (solid) 1200 R S S R 20 3 0 4 0 5 0 C0 CL C wt% Ni The Lever Rule: an interpretation • Tie line – connects the phases in equilibrium with each other – also sometimes called an isotherm What fraction of each phase? Think of tie line as a lever
T(°C) L: 35wt%Ni L (liquid) a 130 0 A + L L: 35 wt% Ni B a: 46 wt% Ni 35 46 C 32 43 D L: 32 wt% Ni 24 36 a a: 43 wt% Ni + 120 0 E L L: 24 wt% Ni a: 36 wt% Ni a (solid) 110 0 35 20 3 0 4 0 5 0 wt% Ni C0 Phase and Microstructure (equilibrium) Example: Cooling in Cu-Ni Binary • Consider microstuctural changes that accompany the cooling of a C0 = 35 wt% Ni alloy • From liquid, solid phase nucleates. • From solid, other phases can nucleate. • Like ice, many grains of solid form. • wt% of SOLUTE given by line dropped from boundaries • Fraction of PHASES present given by the “lever rule”. • Microstructure different depending on cool slowly or quench.
Phases and Microstructure (non-equilibrium) • Upon cooling quickly (i.e. nonequilibrium), microstructure has range of composition depending on when it was formed. • Inside nucleus of solid phase higher composition (in Cu-Ni case) due to its creation at higher T. • Outside part of growing solid phase nucleus has lower composition due to its forming at lower T. Core-like development
Cored versus Equilibrium Phases • Ca changes as we solidify. • Cu-Ni case: First a to solidify has Ca = 46 wt% Ni. Last a to solidify has Ca = 35 wt% Ni. • Fast rate of cooling: Cored structure • Slow rate of cooling: Equilibrium structure
60 %EL for pure Cu 400 %EL for 50 pure Ni TS for Elongation (%EL) 40 pure Ni Tensile Strength (MPa) 300 30 TS for pure Cu 200 20 0 20 40 60 80 100 0 20 40 60 80 100 Cu Ni Cu Ni Composition, wt% Ni Composition, wt% Ni Recall: Mechanical Properties of Cu-Ni • Effect of solid solution strengthening on: --Ductility (%EL,%AR) --Tensile strength (TS) -Peak as a function of Co -Minimum as a function of Co
Cu-Ag system T(°C) 1200 L (liquid) 1000 a L + a b L + 779°C b 800 TE 8.0 91.2 71.9 600 a + b 400 200 80 100 0 20 40 60 CE C , wt% Ag cooling heating Binary-Eutectic Systems has a special composition with a minimum melting T. • Ex: Cu-Ag • 3 single-phase regions • (L, , ) • Limited solubility • : mostly Cu • : mostly Ag • TE: no liquid below TE. • cE: composition for min. melting T (Eutectic). Eutectic: direct from liquid to 2-phase solid upon cooling: L +
T(°C) 300 L (liquid) a L + a b b L + 200 183°C 18.3 61.9 97.8 C- C0 150 S R S = W = R+S C- C 100 a + b 99 - 40 59 = = = 0.67 99 - 11 88 100 0 11 20 60 80 99 40 C0- C R W C C C0 = = C, wt% Sn C - C R+S 40 - 11 29 = = 0.33 = 99 - 11 88 Solder for electronics Example 1: Lead-Tin (Pb-Sn) Eutectic Diagram • For a 40wt%Sn-60wt%Pb alloy at 150oC, determine... --phases present: a + b --compositions of phases: Ca = 11 wt% Sn Cb = 99 wt% Sn -- relative amount of each phase: Use the “Lever Rule” Adapted from Fig. 10.8, Callister & Rethwisch 3e.
T(°C) 300 L (liquid) a L + 220 a b b R L + S 200 CL - C0 46 - 40 183°C = W = = 0.21 a CL - C 46 - 17 100 a + b 100 17 46 0 20 40 60 80 C CL C0 C, wt% Sn C0 - C 23 = WL = = 0.79 CL - C 29 Example 2: Pb-Sn Eutectic System • For a 40 wt% Sn-60 wt% Pb alloy at 220°C, determine: -- phases present: a + L -- phase compositions Ca = 17 wt% Sn CL = 46 wt% Sn -- relative amt of phases
T(°C) L: C0wt% Sn 400 L a L 300 L a + a 200 (Pb-Sn a: C0wt% Sn TE System) 100 b + a 0 10 20 30 C , wt% Sn C0 2 (room T solubility limit) Microstructure for Eutectic Diagrams: Pb-Sn • For alloys with C0 < 2 wt% Sn • Result: at room temperature -- polycrystalline with grains of a phase having C0 • Note: liquid-to-solid creates grain boundaries.
L: C0 wt% Sn T(°C) 400 L L 300 a L + a a: C0wt% Sn a 200 TE a b 100 b + a Pb-Sn system 0 10 20 30 C , wt% Sn C0 2 (sol. limit at T ) 18.3 room (sol. limit at TE) Microstructure for Eutectic Diagrams: Pb-Sn • For alloys with 2 wt% Sn < C0< 18.3 wt% Sn • Result: at T’s in a + b range -- polycrystalline with agrains and small b-phase particles • Note: Solubility depends on T.
Micrograph of Pb-Sn T(°C) eutectic L: C0 wt% Sn microstructure 300 L Pb-Sn system a L + a b L 200 183°C TE 100 160m a : 97.8 wt% Sn Adapted from Fig. 10.14, Callister & Rethwisch 3e. : 18.3 wt%Sn 0 20 40 60 80 100 97.8 18.3 CE C, wt% Sn 61.9 Microstructure at Eutectic • For alloy of composition C0 = CE • Result: Eutectic microstructure (lamellar structure) -- alternating layers (lamellae) of a and b phases. Light: Sn-rich Dark: Pb-rich Adapted from Fig. 10.13, Callister & Rethwisch 3e.
Lamellar Eutectic Structure Diffusion local Adapted from Figs. 10.14 & 10.15, Callister & Rethwisch 3e.
• Just above TE : L T(°C) L: C0 wt% Sn Ca = 18.3 wt% Sn L CL = 61.9 wt% Sn 300 L Pb-Sn system S Wa L + = 0.50 = R + S a b WL = (1- W ) = 0.50 L + a R S 200 TE S R • Just below TE : C = 18.3 wt% Sn 100 + a primary C = 97.8 wt% Sn a eutectic S b eutectic W = 0.73 = R + S 0 20 40 60 80 100 W = 0.27 18.3 61.9 97.8 Adapted from Fig. 10.16, Callister & Rethwisch 3e. C, wt% Sn Microstructure “below” Eutectic (hypoeutectic) • For alloys for 18.3wt%Sn < Co < 61.9wt%Sn • Result: a crystals and a eutectic microstructure
Solder: Lead-Tin (Pb-Sn) microstructure • For 50 wt% Pb alloy: • Lead-rich phase (dark) • Lamellar eutectic structure • of Sn-rich phase (light). L L + + * Why is Liquid-phase ~62.9wt%Sn and -phase ~16.3wt%Sn at 180 C? * For fraction of total phase (both eutectic and primary), use the Lever Rule.
Hypoeutectic & Hypereutectic Adapted from Fig. 10.8, Callister & Rethwisch 3e. (Figs. 10.14 and 10.17 from Metals Handbook, 9th ed., Vol. 9, Metallography and Microstructures, American Society for Metals, Materials Park, OH, 1985.)
Mg2Pb Intermetallic Compounds Adapted from Fig. 10.20, Callister & Rethwisch 3e. Intermetallic compounds exists as a line on the phase diagram - not an area - because of stoichiometry (i.e. c of a compound is a fixed value).
cool cool cool heat heat heat • Eutectoid – one solid phase transforms to two other solid phases • S2S1+S3 • + Fe3C (For Fe-C, 727C, 0.76 wt% C) intermetallic compound - cementite • Peritectic - liquid and one solid phase transform to a second solid phase • S1 + LS2 • + L (For Fe-C, 1493°C, 0.16 wt% C) Eutectic, Eutectoid, & Peritectic • Eutectic - liquid transforms to two solid phases • L + (For Pb-Sn, 183C, 61.9 wt% Sn)
Peritectic transformation + L Eutectoid transformation + Eutectoid, & Peritectic Cu-Zn Phase diagram Adapted from Fig. 10.21, Callister & Rethwisch 3e.
Ceramic Phase Diagrams MgO-Al2O3 diagram: Adapted from Fig. 10.24, Callister & Rethwisch 3e.
Iron-Carbon (Fe-C) Phase Diagram T(°C) 1600 Adapted from Fig. 10.28,Callister & Rethwisch 3e. d L 1400 g +L A - Eutectic (A): g L+Fe3C 1200 1148°C (austenite) Þ g + L Fe3C A - Eutectoid (B): 1000 g +Fe3C Fe3C (cementite) a g Þ a + Fe3C g g + 800 g a g g B 727°C = T eutectoid 600 a +Fe3C 400 0 1 2 3 4 5 6 6.7 C, wt% C (Fe) Result: Pearlite is 4.30 0.76 alternating layers of and Fe3C phases 120 mm a Fe3C (cementite-hard) a (ferrite-soft) • 2 points
T(°C) 1600 d L 1400 (Fe-C g +L g g g System) 1200 L+Fe3C 1148°C (austenite) g g g 1000 g g +Fe3C g g Fe3C (cementite) a g g 800 727°C a a a g g 600 a +Fe3C 400 0 1 2 3 4 5 6 6.7 a C, wt% C (Fe) C0 0.76 pearlite Hypoeutectoid 100 mm steel pearlite proeutectoid ferrite Adapted from Fig. 10.34, Callister & Rethwisch 3e. Hypoeutectoid Steel Adapted from Figs. 10.28 and 10.33
T(°C) 1600 d L 1400 (Fe-C g +L g System) 1200 L+Fe3C 1148°C (austenite) 1000 g +Fe3C Wa= s/(r+s) Wa’= S/(R+S) Fe3C (cementite) a r s g g 800 Wg=(1 - Wa) W=(1 – Wa’) 727°C a a a g g R S 600 a +Fe3C 400 0 1 2 3 4 5 6 6.7 a C, wt% C (Fe) C0 0.76 Wpearlite=Wg pearlite Hypoeutectoid 100 mm steel Fe3C pearlite proeutectoid ferrite Adapted from Fig. 10.34, Callister & Rethwisch 3e. Hypoeutectoid Steel
T(°C) 1600 d L 1400 g +L g g g 1200 L+Fe3C 1148°C g g (austenite) g 1000 g g +Fe3C g g Fe3C (cementite) Fe3C 800 g g a g g 600 a +Fe3C 400 C0 0 1 2 3 4 5 6 6.7 C, wt%C 0.76 (Fe) pearlite Hypereutectoid 60mm steel pearlite proeutectoid Fe3C Adapted from Fig. 10.37, Callister & Rethwisch 3e. Hypereutectoid Steel
T(°C) 1600 d L 1400 g +L g Fe3C 1200 L+Fe3C 1148°C (austenite) 1000 g +Fe3C Wg=x/(v + x) Fe3C (cementite) x v 800 g W=(1-Wg) g Fe3C a g g V X 600 a +Fe3C 400 C0 0 1 2 3 4 5 6 6.7 C, wt%C 0.76 (Fe) pearlite Wpearlite=Wg Wa= X/(V+X) Hypereutectoid 60mm W=(1 - Wa) steel Fe3C’ pearlite proeutectoid Fe3C Adapted from Fig. 10.37, Callister & Rethwisch 3e. Hypereutectoid Steel
Example Problem Steel • For a 99.6 wt% Fe-0.40 wt% C steel at a temperature just below the eutectoid, determine the following: • The compositions of Fe3C and ferrite (). • The amount of cementite (in grams) that forms in 100 g of steel. • The amounts of pearlite and proeutectoid ferrite () in the 100 g.
1600 d L 1400 T(°C) g +L g 1200 L+Fe3C 1148°C (austenite) 1000 g +Fe3C Fe3C (cementite) 800 Amount of Fe3C in 100 g = (100 g)WFe3C = (100 g)(0.057) = 5.7 g 727°C R S 600 a +Fe3C 400 0 1 2 3 4 5 6 6.7 C0 C C, wt% C CFe C 3 Solution to Problem a) Use RS tie line just below Eutectoid Ca = 0.022 wt% CCFe3C = 6.70 wt% C • Use lever rule with the tie line shown
1600 d L 1400 T(°C) g +L g 1200 L+Fe3C 1148°C (austenite) 1000 g +Fe3C Fe3C (cementite) Amount of pearlite in 100 g = (100 g)Wpearlite = (100 g)(0.512) = 51.2 g 800 727°C V X 600 a +Fe3C 400 C0 0 1 2 3 4 5 6 6.7 C C C, wt% C Solution to Problem c) Using the VX tie line just above the eutectoid and realizing that C0 = 0.40 wt% CCa = 0.022 wt% CCpearlite = C = 0.76 wt% C
Alloying Steel With More Elements • Teutectoid changes: • Ceutectoid changes: (wt% C) Ti Si Mo (°C) Ni W Cr Cr eutectoid Eutectoid Si Mn W Mn Ti Mo C T Ni wt. % of alloying elements wt. % of alloying elements Adapted from Fig. 10.38,Callister & Rethwisch 3e. (Fig. 10.38 from Edgar C. Bain, Functions of the Alloying Elements in Steel, American Society for Metals, 1939, p. 127.) Adapted from Fig. 10.39,Callister & Rethwisch 3e. (Fig. 10.39 from Edgar C. Bain, Functions of the Alloying Elements in Steel, American Society for Metals, 1939, p. 127.)
Summary Phase Diagrams and Microstructures • Phase (T vs c) diagrams are useful to determine: - the number and types of phases, - the wt% of each phase, - and the composition of each phase for a given T and composition of the system. • Alloying to produce a solid solution usually - increases the tensile strength (TS) - decreases the ductility. • Binary eutectics and binary eutectoids allow for a range of microstructures. - Alloy composition and annealing temperature and time determine possible microstructure(s). Slow vs. Fast. - In 2-phase regions, use “lever rule” to get wt% of phases. - Varying microstructure affects mechanical properties.