Download
1 / 6
80 likes | 189 Vues
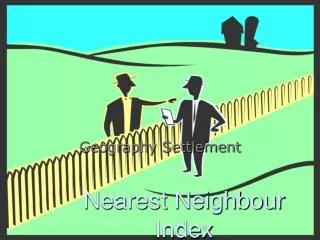
Inferential Statistics 4: Nearest Neighbour Analysis. Advanced Higher Geography Statistics. Ollie Bray – Knox Academy, East Lothian. Introduction. Settlements often appear on the map as dots. Dot distributions are commonly used in geography, yet their patterns are difficult to describe.

E N D
Inferential Statistics 4: Nearest Neighbour Analysis Advanced Higher Geography Statistics Ollie Bray – Knox Academy, East Lothian
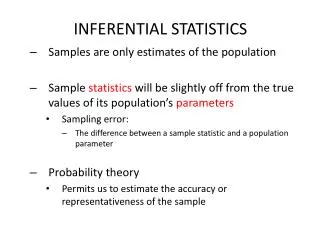
Introduction • Settlements often appear on the map as dots. Dot distributions are commonly used in geography, yet their patterns are difficult to describe. • One way in which patterns can be measured objectively is by nearest neighbour analysis. • It can be used to identify a tendency towards clustering or dispersion for shop, industries, settlements, etc. • Nearest neighbour analysis gives a index that enables one region to be compared with another.
Rn = 2Ď √(n/a) note that Rn is the nearest neighbour index. D = the average distance between each point and its nearest neighbour n = the number of points under study A = the size of the area under study Ď =∑d / n Where d is the distance between each point and its nearest neighbour Formula A good one to sit down for!
The formula produced by the nearest neighbour analysis produces a figure expressed as Rn (the nearest neighbour index) which measures the extent to which the pattern is clustered, random or regular. • Clustered: Rn = 0 All the dots are close to the same point. • Random: Rn = 1.0 There is no pattern. • Regular: Rn = 2.15 There is a perfectly uniform pattern where each dot is equidistant from its neighbours.
How to undertake a nearest neighbour analysis • Measure the straight line distance between each point and its nearest neighbour. • Total all of the distances measured above (∑d/n). This is Ď in the formula. • Calculate the total area of your study area. • Fit your calculations into the formula to calculate (Rn) The area of the study must have a minimum of 30 points (settlements, shops, plant species, etc)
And then Using the Rn number, refer to the diagram below to determine how regular or clustered the pattern is. ©Learning and Teaching Scotland. From Geographical Measurements and Techniques: Statistical Awareness, June 2000. Now look for geographical factors to explain your findings