Download
1 / 21
340 likes | 905 Vues
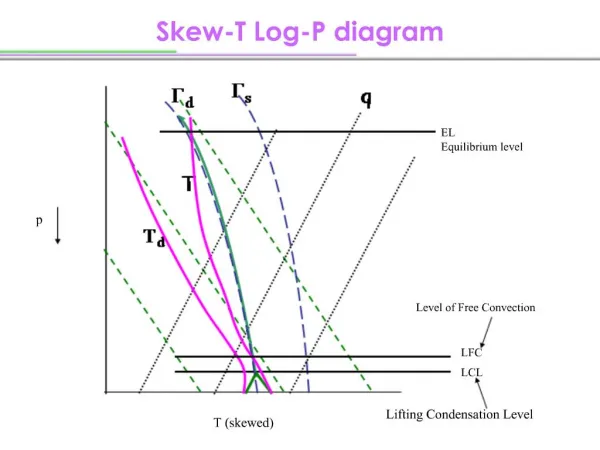
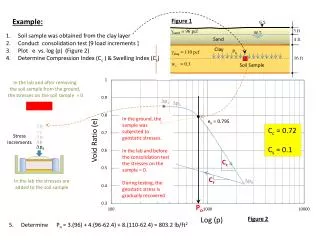
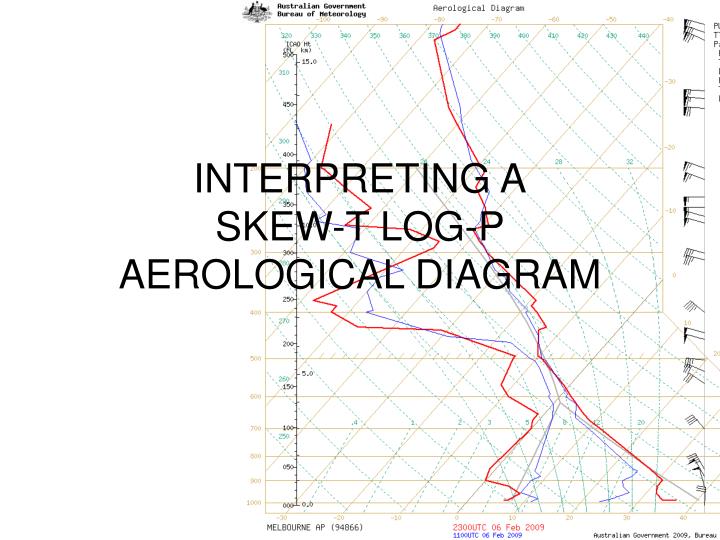
INTERPRETING A SKEW-T LOG-P AEROLOGICAL DIAGRAM. Locate pressure level (and matching ICAO Height) 400 m ASL 970 hPa. Read off T and Tdp from that level T = 32°C Tdp = 7°C. Follow Tdp upwards along line of constant mixing ratio. Mixing ratio = 6.5 g/kg. Follow T upwards along dry adiabat.

E N D
Locate pressure level (and matching ICAO Height) • 400 m ASL • 970 hPa
Read off T and Tdp from that level • T = 32°C • Tdp = 7°C
Follow Tdp upwards along line of constant mixing ratio. • Mixing ratio = 6.5 g/kg
Follow T upwards along dry adiabat. • Potential temperature = 307 K= 34°C
Lines cross at Lifting Condensation Level = cloud base. • LCL = 670 hPa • LCL = 3400 m (ICAO)
Dry adiabat is cooler than Environmental Lapse Rate (right-hand red line) at all levels. • Air is stable
Between the surface and 900hPa the reversed ELR shows the mixing layer. • As the day heats up this will move to the right, to the grey line.
Now…Let’s add heat to the surface air with a fire (no additional moisture). • T = 50°C
Potential temperature = 323 K • LCL = 540 hPa • LCL = 5000 m (ICAO) • T @ LCL= -2°C
Dry adiabat is warmer than ELR – air is unstable. • Above LCL air rises along Saturated Adiabat.
Dynamic inversion when saturated adiabat and ELR cross. • P = 250 hPa • Height = 10500 m (ICAO) • T = -42°C
Winds at surface • 35 kts (60 km/hr) from N
Winds at LCL • 30 kts (50 km/hr) from NW
Winds at dynamic (plume) inversion. • 55 kts(100 km/hr)from W
So under these conditions a hot backburn would move to the south, but its plume, rising to 10km height, would increasingly rotate to the left as it rose.
Additionally, pyro-cumulus clouds would form within the plume at 5000m. • We have no information on fuels, and so cannot assess how much cloud.
CALCULATING HAINES INDEX • T850=27°C • T700=12°C • DP850=-1°C • Stability term = 3 (range of 15°) • Moisture term = 3 (range of 28°) • Index = 3+3 = 6
CALCULATING CONTINUOUS HAINES INDEX (CH) • CA = (T850-T700)/2-2 • CA = 5.5 • CB = (T850-DP850)/3-1 • If(CB > 9) then CB = 9 • If(CB > 5) then CB = 5+(CB-5)/2 • CH=CA+CB • CB=6.7 • CH=12.2 • 95% HI = 8.5
CALCULATING FUEL MOISTURE CONTENT • FMI = 21-(2*T-Tdp)/4 • FMI=7% • FMC=7*FMI/DF • If DF = 10, FMC = 5%