Download
1 / 26
270 likes | 457 Vues
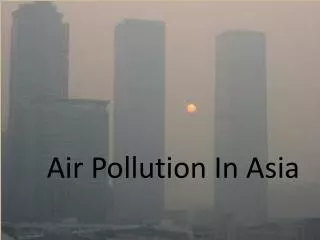
Air Pollution Challenges in Southeast Asia. Glynda Bathan Deputy Executive Director Clean Air Asia 2 nd ASEAN Chief Justices Roundtable Discussion 8 December 2012. Air pollution in Asia risks getting worse again. WHO interim target 1 PM10 – 70 µg/m3. WHO annual guideline NO2 – 40 µg/m3.

E N D
Air Pollution Challenges in Southeast Asia GlyndaBathan Deputy Executive Director Clean Air Asia 2nd ASEAN Chief Justices Roundtable Discussion 8 December 2012
Air pollution in Asia risks getting worse again WHO interim target 1 PM10 – 70 µg/m3 WHO annual guideline NO2 – 40 µg/m3 WHO annual guideline PM10 – 20 µg/m3 WHO daily guideline SO2 – 20 µg/m3
Global Burden of Disease 2000Mortality attributable to leading risk factors Outdoor Air Pollution ranked 13th Ezzati et al. 2002; WHO 2002
Poor air quality: 7 of 10 cities in developing Asia PM10 annual average concentrations µg/m3 >150 100-150 70-100 WHO Interim Target 1 70 µg/m3 50-70 30-50 20-30 WHO Air Quality Guideline 20 µg/m3 <20
Asthma, impaired lung function, cardiovascular illness and deaths
Motorization rates are increasing Motorization in Asia (2010) Source: Accessing Asia, Clean Air Asia 2012
Vehicle Ownership Source: Data from the World Bank and Clean Air Asia
2-wheelers are in the majority… Vehicle Types (2010) Source: Accessing Asia, Clean Air Asia 2012
…but trucks generate most CO2 emissions Road Transport CO2 Emissions by Vehicle Type (2010) Source: Accessing Asia, Clean Air Asia 2012
Asia remains dependent on diesel Estimated share of diesel in road transport fuel consumption (2010) 62% 52% 91% 77% 64% ASIA BAN IND INO LAO 31% 85% 85% 65% 58% MAL NEP PAK PHI PRC 31% *Note: share of fuel consumption of diesel was estimated based on vehicle population by fuel type Source: Clean Air Asia estimates, 2012 74% 69% 57% SIN SRI THA VIE
Exposure zone within 300 to 500 meters from a highway or a major road is most highly affected by traffic emissions • Health Effects Institute • Traffic-Related Air Pollution: A Critical Review of the Literature on Emissions, Exposure, and Health Effects. 2010
The Traffic Impact Area in Delhi 55% of the population within 500 meters of a freeway; 50 meters of a major road (Health Effects Institute analysis)
The Traffic Impact Area in Beijing HEI Analysis: 76% of the Population within 500 meters of a Freeway; 50 meters of a Major Road (Health Effects Institute analysis)
More people moving to cities 120,000 people a day 44 million people added to Asian cities every year 1.1 billion People added to Asian cities in the next 30 years ADB
Vehicles are key to Solving the PM2.5 Problem • Vehicles contribute 22-34% of PM2.5 in megacities, but percentage is growing • Actual impacts much higher when considering secondary pollution • Roadside exposure much higher in dense urban areas Micheal Walsh, 2012
PM2.5 Annual Standards 2012 Note: China’s new PM2.5 annual standard (35 µg/m3) is for national implementation in 2016. 2012 implementation of new standard: for Beijing, Tianjin, YRD, PRD, municipalities and provincial capital cities Clean Air Asia 2012
Asia goals 2016: monitoring and data • Air quality monitoring systems and report data publicly • Air pollution and GHG indicators for transport and energy
Asia goals: policies • City Clean Air Plans and reports • “Avoid-Shift-Improve” policies for transport • Maintain or improve share of non-motorized and public transport • Effective programs for in-use vehicles • National green freight programs • Demonstration of clean truck technologies
Low emissions urban development Ho Chi Minh City 2010
Low emissions urban development Ho Chi Minh City 2030 BAU
Low emissions urban development Ho Chi Minh City 2030 Low Emissions
Low Emissions 2030 Baseline BAU 2030 Ahmedabad Transport CO2: 38%, PM 60% Electricity CO2 61%, PM 45% Colombo Transport CO2: 15%, PM 32% Electricity CO2 30%, PM 68% Ho Chi Minh Transport CO2: 33%, PM 30% Electricity CO2 40%, PM 38%
More information: www.cleanairasia.org Clean Air Asia Center Clean Air Asia China Office center@cleanairasia.org Unit 3505 Robinsons-Equitable Tower ADB Avenue, Pasig City Metro Manila 1605 Philippines Clean Air Asia India Office china@cleanairasia.org 901A Reignwood Building, No. 8 YongAnDongLi Jianguomenwai Avenue Beijing China india@cleanairasia.org 1st Floor, Building No. 4 Thyagraj Nagar Market, Lodhi Colony New Delhi 110003 India Clean Air Asia Country Networks China . India . Indonesia . Nepal . Pakistan . Philippines . Sri Lanka . Vietnam Clean Air Asia Donors in 2012 236 Clean Air Asia Partnership Members Clean Air Asia Center Members Asian Development Bank Cities Development Initiative for Asia ClimateWorks Foundation DHL/IKEA/UPSEnergy Foundation Fredskorpset Norway Fu Tak Iam Foundation German International Cooperation (GIZ) Institute for Global Environmental Strategies (IGES) Institute for Transport Policy Studies Institute for Transportation and Development Policy International Union for Conservation of Nature L'Agence Française de Développement (AFD) MAHA Pilipinas Shell Rockefeller Brothers Fund Shakti Foundation Shell Foundation United Nations Environment Program Partnership for Clean Fuels and Vehicles (UNEP PCFV) USAID CEnergy Veolia World Bank • Cities • Environment ministries and government agencies • Development agencies and foundations • Non-government organizations • Academic and research institutions • Private sector companies and associations