Download
1 / 52
520 likes | 523 Vues
Creating Hydrologic Information Systems. David R. Maidment Utah State University 9 February 2004. ArcIMS Website http://emrcims.uwrl.usu.edu uses data stored in an ArcGIS geodatabase. Watershed Information System. GIS map data on watersheds, lakes, gages, streams, dams,….

E N D
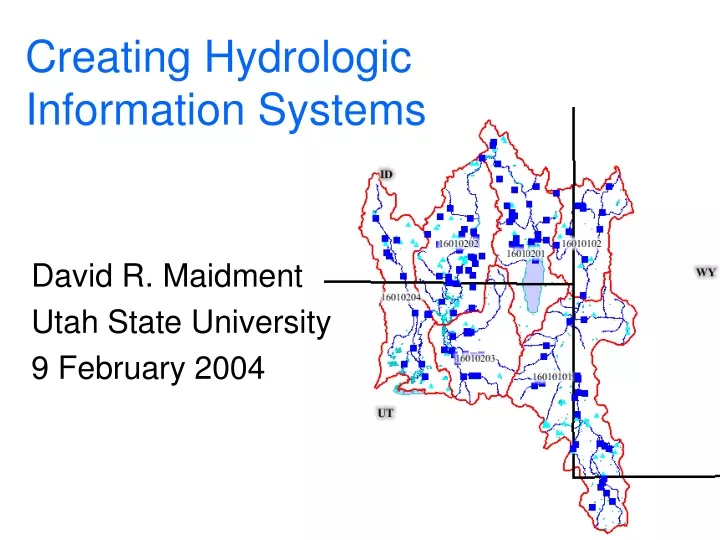
Creating Hydrologic Information Systems David R. Maidment Utah State University 9 February 2004
ArcIMS Website http://emrcims.uwrl.usu.edu uses data stored in an ArcGIS geodatabase
Watershed Information System • GIS map data on watersheds, lakes, gages, streams, dams,…. • GIS surface data on terrain, land cover, precipitation • Monitoring point information on streamflow, water quality, climate USGS gage
Nexrad Radar 06:09 PM MST Sun Feb 8th 2004
Nexrad Data from NOAAPort About 3 minutes between measurement and local delivery of information NOAAPort http://www.rap.ucar.edu/weather/radar/
Unidata Weather Data • Unidata is part of UCAR (Universities Corporation for Atmospheric Research) • Unidata ingests data from NOAAPort and other sources • Unidata streams weather data continuously to about 180 US universities • Data received by a local data manager (LDM) • USU has an LDM
Weather Information Continuous in space and time Combines data and simulation models Delivered in real time Hydrologic Information Static spatial info, time series at points Data and models are not connected Mostly historical data Weather and Hydrology • Challenges for Hydrologic Information Systems • How to better connect space and time? • How to connect space, time and models? • How to connect weather and hydrology?
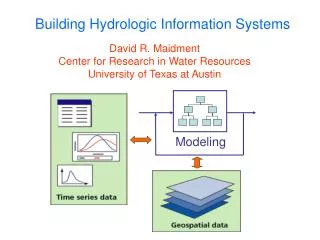
Modeling Geodatabase Hydrologic Information System A hydrologic information system is a combination of geospatial and temporal hydrologic data and hydrologic models that supports hydrologic practice, science and education
Arc Hydro is customized version of ArcGIS for water resources data CRWR GIS CRWR Arc Hydro Water Resources
Drainage System Hydro Network Flow Time Time Series Hydrography Channel System Arc Hydro Components
Arc Hydro Framework Data Model
Arc Hydro Framework For South Florida Basins Waterbody (NHD) Hydro Points National Hydrography Dataset, NHD
Nexrad over South Florida • Real-time radar rainfall data calibrated to raingages • Data received each 15 minutes • 2 km grid • Stored by SFWMD in Arc Hydro format
Nexrad data in Arc Hydro Attribute series Display as a temporal layer in ArcGIS Tracking Analyst
ArcGISTracking Analyst Displays data in space and time Fecal Coliform in Galveston Bay 1995-2001 Tracking Analyst Demo
Map Attributes Time Series Attribute Series Map Features Attribute Series: A map attribute that is a time series for each feature
Variable Time Time and Space in GIS Time Series Feature Series t3 t2 Value t1 Time Attribute Series Raster Series Value t3 t2 t1 t1 t2 t3 y x
Variable Time t1 t2 t3 Time Series and Temporal Geoprocessing DHI Time Series Manager Time Series Feature Series t3 t2 Value t1 Time Attribute Series Raster Series Value t3 t2 t1 y x ArcGIS Temporal Geoprocessing
Time series from gages in Kissimmee Flood Plain • 21 gages measuring water surface elevation • Data telemetered to central site using SCADA system • Edited and compiled daily stage data stored in corporate time series database called dbHydro • Time series downloaded from dbHydro and stored for all gages as Arc Hydro Attribute Series
Arc Hydro Attribute Series Map features have a time varying attribute HydroID 2906 Feature Class (HydroID) Attribute Series Table (FeatureID)
Raster Series Ponded Water Depth Kissimmee River June 1, 2003
Weather and Hydrology • NetCDF describes atmospheric and water properties varying continuously in (x,y,z,t) • GIS describes the physical landscape, • Vector GIS has spatially discrete features (point, line area) • Raster GIS is spatially continuous (in 2D) • How do we connect the “water” with the “water environment”
Arc Hydro Attribute Series TSDateTime Feature Class (point, line, area) TSValue FeatureID TSType TSType Table
NetCDF Data Model (developed at Unidata for distributing weather data) Time Dimensions and Coordinates Value Space (x,y,z) NetCDF describes a collection of variables whose values are stored at coordinate points in the (x,y,z,t) dimensions Variables Attributes
NetCDF File for Weather Model Output of Relative Humidity (Rh) dimensions: lat = 5, lon = 10, time = unlimited; variables: lat:units = “degrees_north”; long:units = “degrees_east”; time:units = “hours since 1996-1-1”; data: lat = 20, 30, 40, 50, 60; long = -160, -140, -118, -96, -84, -52, -45, -35, -25, -15; time = 12; rh = .5,.2,.4,.2,.3,.2,.4,.5,.6,.7, .1,.3,.1,.1,.1.,.1,.5,.7,.8,.8, .1,.2,.2,.2,.2,.5,.7,.8,.9,.9, .1,.2,.3,.3,.3,.3,.7,.8,.9,.9 .0,.1,.2,.4,.4,.4,.4,.7,.8,.9; rh (time, lat, lon);
Interpolate to Raster GeoTiff format, cell size = 0.5º
Average Rh in each State Determined using Spatial Analyst function Zonal Statistics with Rh as underlying raster and States as zones
Model Builder in Arc 9 Relative Humidity Analysis Model Model Builder Demo
GIS Preprocessors for Hydrologic Models GIS Interface Model 1 Database Model 2 Model 3
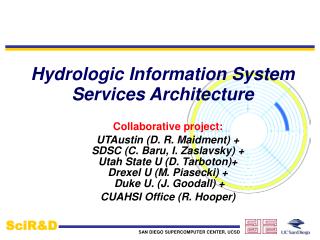
Geographically Integrated Hydrologic Modeling Systems GIS Interfacedata models HMS Geo Database Arc Hydro data model RAS WRAP
Regional Storm Water Modeling Program and Master Plan for San Antonio City of San Antonio
San Antonio Regional Watershed Modeling System Geospatial Data: City, County SARA, other “Bring the models together” Modeling System Rainfall Data: Rain gages Nexrad Calibration Data: Flows Water Quality Floodplain Management Capital Improvement Planning Water quality planning Integrated Regional Water Resources planning Flood Forecasting
Regional Watershed Modeling System Case Study Salado Creek watershed Components: • Arc HydroGeodatabase • for whole watershed • HEC-HMShydrology model • for whole watershed • HEC-RAShydraulic model • for Rosillo Creek Bexar County Rosillo Creekwatershed
Arc Hydro and HEC-HMS HEC-HMS Hydrologic Model Arc Hydro Schematic Network Calculates Flows
Arc Hydro and HEC-RAS HEC-RAS Hydraulic Model Calculates Water Surface Elevations Arc Hydro Channel Cross Sections
HEC Data Storage System (DSS)(binary data file system shared by HEC models) • Model features define the spatial framework • One or a few variables modeled • Values for each time interval • One time series may be associated with many features • Many modeling scenarios Time series catalog Many time series
Flow Change Points Models communicate with one another through Arc Hydro at designated points
FLOODPLAIN MAP Nexrad Map to Flood Map in Arc 9 Model Builder Flood map as output Model for flood flow HMS Model for flood depth Nexrad rainfall map as input
HMS Hydrologic Information System Models • Hydrologic simulation models • Hydrologic data models • Hydrologic workflow models • All of these can be delivered through ArcIMS Arc Hydro
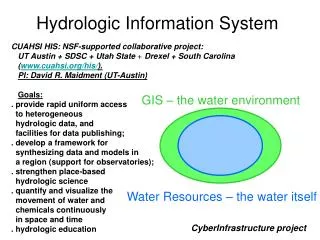
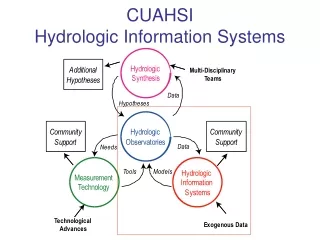
CUAHSI Hydrologic Information System Experiments Monitoring 1. Assemble data from many sources Information Sources Remote sensing GIS Climate models 2. Integrate data into a coherent structure Hydrologic Data Model Hypothesis testing Analysis and Visualization 3. Do science Statistics Data Assimilation Simulation
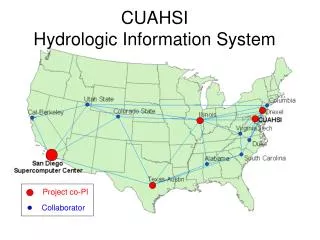
Hydrologic Information Partners Institutions of participants in the CUAHSI HIS Proposal
Digital Watershed:An implementation of the CUAHSI Hydrologic Data Model for a particular region Created first for the Neuse basin and then for each of the following CUAHSI Observatory Planning basins
3D Control Volume of Neuse Basin Fluxes Extrude watershed boundary 15 km up into atmosphere and 1 km down into subsurface
Observatory Goal: Hydrologic Fluxes • Improve predictive understanding of fluxes of • Water • Sediment • Nutrients • [Selected Contaminants] • Across spatial scales, including catchment outlet • Riverine fluxes, at a minimum, but also fluxes across other interfaces (PI-specified) Need for definition of “HydroElements”, at any location in hydrologic system