Download
1 / 16
160 likes | 296 Vues
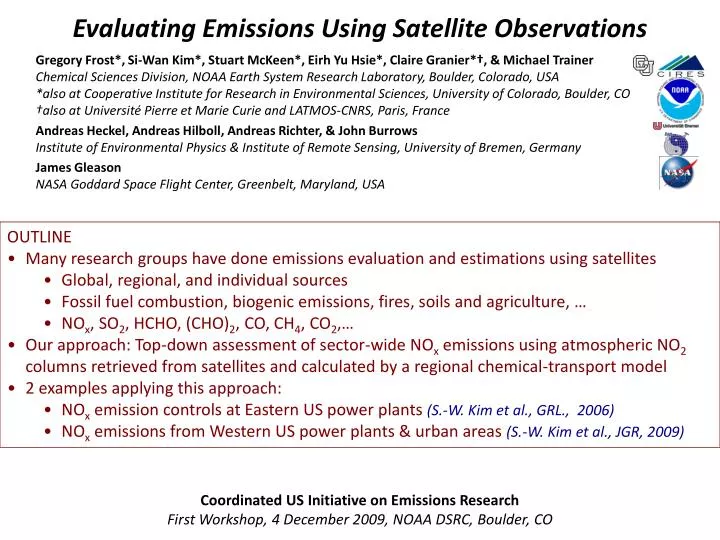
Gregory Frost*, Si-Wan Kim*, Stuart McKeen*, Eirh Yu Hsie*, Claire Granier*†, & Michael Trainer Chemical Sciences Division, NOAA Earth System Research Laboratory, Boulder, Colorado, USA *also at Cooperative Institute for Research in Environmental Sciences, University of Colorado, Boulder, CO

E N D
Gregory Frost*, Si-Wan Kim*, Stuart McKeen*, Eirh Yu Hsie*, Claire Granier*†, & Michael Trainer Chemical Sciences Division, NOAA Earth System Research Laboratory, Boulder, Colorado, USA *also at Cooperative Institute for Research in Environmental Sciences, University of Colorado, Boulder, CO †also at Université Pierre et Marie Curie and LATMOS-CNRS, Paris, France Andreas Heckel, Andreas Hilboll, Andreas Richter, & John Burrows Institute of Environmental Physics & Institute of Remote Sensing, University of Bremen, Germany James Gleason NASA Goddard Space Flight Center, Greenbelt, Maryland, USA Evaluating Emissions Using Satellite Observations • OUTLINE • Many research groups have done emissions evaluation and estimations using satellites • Global, regional, and individual sources • Fossil fuel combustion, biogenic emissions, fires, soils and agriculture, … • NOx, SO2, HCHO, (CHO)2, CO, CH4, CO2,… • Our approach: Top-down assessment of sector-wide NOx emissions using atmospheric NO2 columns retrieved from satellites and calculated by a regional chemical-transport model • 2 examples applying this approach: • NOx emission controls at Eastern US power plants (S.-W. Kim et al., GRL., 2006) • NOx emissions from Western US power plants & urban areas (S.-W. Kim et al., JGR, 2009) Coordinated US Initiative on Emissions Research First Workshop, 4 December 2009, NOAA DSRC, Boulder, CO
NOx emissions NO2 columns (summer day short NOx lifetime) • Satellite-observations of NO2columns in combination with chemical-transport models • Understand and improve NOx emissions (Martin et al., 2003; Beirle et al., 2003; Richter et al., 2005; van der A, 2006; Kim et al., 2006 & 2009; … ) • Uncertainties in satellite retrieval and modeling (Boersma et al., 2004; Kim et al. 2009) • US power plant measure their NOxemissions in-stack (CEMS) • More accurate modeled NO2 columns • Evaluate & calibrate satellite NO2 columns over power plants with regional model • Satellite-retrieved NO2 columns used to evaluate inventories for other NOxsources Top-Down Emissions Assessment by Satellites
Satellite NO2 Column Retrievals NO2 Column Retrieval Process Spectral fittings to get NO2 slant column (S) Subtraction of stratospheric NO2 column Calculation and application of air mass factor (AMF) to get NO2 vertical column (V) V= S /AMF • AMF calculation: • A priori NO2 profile: chemical-transport models • A priori aerosol profile • Aerosol optical depth • Terrain height • Surface albedo • Temperature & Pressure • Radiative transfer equation: LOWTRAN, etc
WRF-Chem Modeling of NO2 Vertical Columns Weather Research and Forecasting - Chemistry model • www.wrf-model.org/WG11 • Simulates atmospheric chemistry online within WRF meteorological model • Can choose between various modules for gas and aerosol chemistry, planetary boundary layer dynamics, aerosol and cloud microphysics, radiation, and convection Setup for these case studies • Eastern US • Summer 2004 simulation period • 27 x 27 km2 horizontal resolution • Western US • Summer 2005 simulation period • 15 x 15 km2 horizontal resolution • Emissions • EPA NEI1999 and NEI2005 • CEMS power plant emissions NOAA ESRL High Performance Computing System WRF-Chem Summer 2004 Average NO2 Vertical Columns
∆(US) = -36% ∆(Ohio River) = -45% NOx Controls at Eastern US Power Plants • Effects of NOx controls on large point sources in the Eastern US beginning in the late 1990s • National and regional pollution control programs • Focus on coal-burning power plants • Improved burner technology, post-burner scrubbers • Continuous Emission Monitoring Systems (CEMS) • Stack measurements of hourly NOx, SO2, and CO2 emissions made by utility companies • Data for 966 facilities in 1999 and 1427 facilities in 2004 CEMS data show: • Substantial NOx emission reductions since late 1990’s • Amount of electric power generated has increased EPA Clean Air Markets Division Emissions Query Wizard http://camddataandmaps.epa.gov/gdm/index.cfm?fuseaction=emissions.wizard
Summer 2004 Average NO2 Vertical Columns SCIAMACHY WRF-Chem, Reference Emissions (NEI 99) Eastern US Power Plant NOx Controls Detected by Satellite Northeast Urban Corridor Ohio River Valley • Model reproduces satellite NO2 vertical columns over urban areas • Model NO2 columns too large over power plants using 1999 emissions S.-W. Kim et al., Geophys. Res. Lett., 2006
Eastern US Power Plant NOx Controls Detected by Satellite Summer 2004 Average NO2 Vertical Columns SCIAMACHY • WRF-Chem, Updated Power Plant Emissions • Power plants = CEMS 2004 monthly averages • All other sources = NEI 1999 • Model with summer 2004 power plant emissions agrees much better with satellite NO2 columns over power plants • Satellite detects changes in Ohio River Valley from recent power plant NOx emission controls S.-W. Kim et al., Geophys. Res. Lett., 2006
Northeast Urban Corridor 1997 - 2005 E(NOx) < 20% power plant Ohio River Valley 1997 E(NOx) ~ 50% power plant Ohio River Valley 2005 E(NOx) ~ 20% power plant Trends in Eastern US Satellite NO2 and NOx Emissions • Similar trends in satellite NO2 columns and NOx emissions • Power plant NOx controls have decreased NO2 columns • Mobile NOx emission changes smaller than those from power plants S.-W. Kim et al., Geophys. Res. Lett., 2006
Colstrip North Valmy Dave Johnston/ Laramie River Intermountain Jim Bridger/ Naughton Hunter / Huntington Reid Gardener Craig/Hayden Bonanza Mohave Four Corners/ San Juan Navajo Cholla/Coronado/ Springerville • Isolated plants have discrete signatures in satellite retrievals • Power plant emissions are measured continuously at each stack • Currently no NOx pollution controls on large coal-burning plants in the West • “Calibration” for satellite-model comparison NOx Emissions from Western US Power Plants S.-W. Kim et al., J. Geophys. Res., 2009 SCIAMACHY, Summer 2005
Model uses observed emissions (CEMS) for power plants Satellite - Model NO2 Column Comparison: Power Plants • Satellite and model NO2 columns nearly equal over Western US power plants • Optimize satellite column retrievals and model parameterizations • Model enables comparison of different satellite retrieval approaches • Consistency for different retrievals: confidence in conclusions about emissions S.-W. Kim et al., J. Geophys. Res., 2009
Build on satellite-model comparisons for power plants • Evaluate urban area emission inventories and monitor changes Denver NOx Emissions from Western US Urban Areas Boise Salt Lake City Reno Sacramento San Francisco Albuquerque / Santa Fe Fresno Bakersfield Los Angeles Las Vegas Phoenix El Paso Tucson S.-W. Kim et al., J. Geophys. Res., 2009 SCIAMACHY, Summer 2005
Note: weekend days are omitted in this analysis Satellite - Model NO2 Column Comparison: Urban Areas • Large satellite - model NO2 column differences over many Western US cities • Urban emissions not well represented by 1999 inventory • Urban model NO2 columns higher than satellite retrievals • Trends in NOx emissions since 1999? S.-W. Kim et al., J. Geophys. Res., 2009
Satellites show weekend decline in urban NO2 columns • Reduced traffic, particularly heavy-duty diesel vehicles • Lower mobile source NOx emissions on weekends • Consistent with roadside monitoring Day-of-Week Trends in Urban Satellite NO2 Columns Model did not include day-of-week variations in NOx emissions Day of week changes in satellite NO2 columns first reported by: S. Beirle et al. (2003), Weekly cycle of NO2 by GOME measurements: a signature of anthropogenic sources, Atmos. Chem. Phys., 3, 2225-2232 S.-W. Kim et al., J. Geophys. Res., 2009
Left axis: NO2 columns averaged over box • Year-to-year declines in satellite NO2 columns in many Western US cities • Coincide with NOx declines seen by roadside monitoring (Ban-Weiss et al., 2008; Bishop and Stedman, 2008). • Effect of cleaner engines, especially light-duty gasoline vehicles • Declining trends in aerosols are not included in retrievals • Declines in satellite NO2 column might be underestimated -8.13%/yr (SCIA) -6.38%/yr (UB OMI) -7.23%/yr (NASA OMI) -2.53%/yr (SCIA) Year-to-Year Trends in Urban Satellite NO2 Columns -6.46%/yr (SCIA) -6.86%/yr (UB OMI) -8.31%/yr (NASA OMI) -4.32%/yr (SCIA) -4.73%/yr (SCIA) -6.57%/yr (UB OMI) -6.35%/yr (NASA OMI) -2.54%/yr (SCIA) S.-W. Kim et al., J. Geophys. Res., 2009
Improved Modeled NO2 Columns with Updated Emissions Modeled NO2 Column Difference (%) = (NEI05 - NEI99) / NEI99 Max = 92 (%) / Min = -78(%) WRF-Chem:NEI99 WRF-Chem:NEI05
Conclusions • Combination of satellite instruments and regional model provides useful evaluation of NOx emission inventories and trends • Satellites detect impact of NOx pollution controls at Eastern US power plants • Large Western US power plant NOx emissions help calibrate NO2 columns • Satellites detect impact of changes in Western US urban NOx emissions that are likely due to motor vehicles Research Needs • Satellite retrievals • Impact of aerosols, temperature, land-use • Can satellites detect other types of NOxsources? • NO2 and aerosol vertical profiles/columns from surface and aircraft instruments • Modeling + other observations • Impact of NOxchanges on O3 and PM • Interactions with inventory developers • Understand differences in top-down and bottom-up approaches • Understand differences between state and national inventories