Download
1 / 29
290 likes | 411 Vues
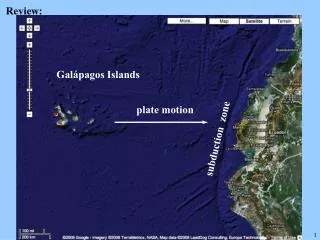
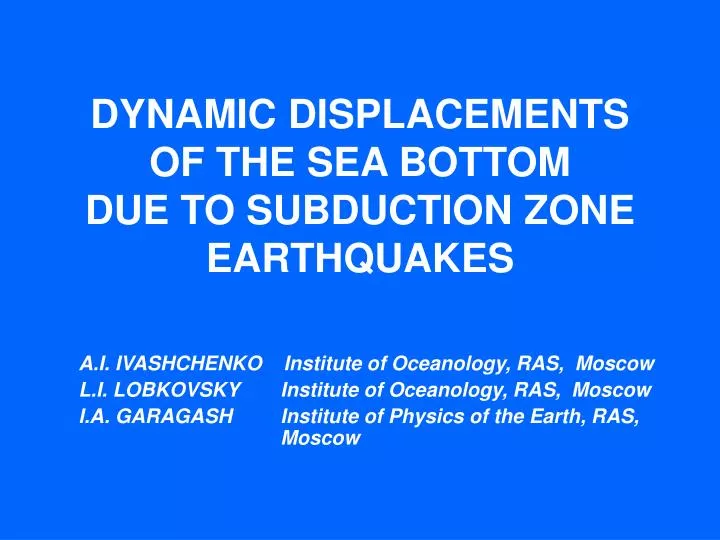
DYNAMIC DISPLACEMENTS OF THE SEA BOTTOM DUE TO SUBDUCTION ZONE EARTHQUAKES. A.I. IVASHCHENKO Institute of Oceanology, RAS, Moscow L . I . LOBKOVSKY Institute of Oceanology, RAS, Moscow I . A . GARAGASH Institute of Physics of the Earth, RAS, Moscow. Introduction.

E N D
DYNAMIC DISPLACEMENTS OF THE SEA BOTTOMDUE TO SUBDUCTION ZONE EARTHQUAKES A.I.IVASHCHENKO Institute of Oceanology, RAS, Moscow L.I. LOBKOVSKY Institute of Oceanology, RAS, Moscow I.A. GARAGASH Institute of Physics of the Earth, RAS, Moscow
Introduction • Tsunami waves in the source produced by the large subduction zone earthquake strongly depend upon: • (i) the type, size and time history of displacements in the earthquake source, and • (ii) sea-bottom topography in the source area • Large uncertainty in numerical tsunami modeling stems from the often poorly-defined sea bottom displacements • Common approach - to infer seabed displacements from the static solution for a dislocation in the elastic half-space (Okada, 1985, 1992; etc.) • - it does not account for the real structure of the lithosphere or the initial state of stress-and-strain in the earthquake source zone • - it does not allow studying the effects of transient seabed movement onto generated tsunami waves
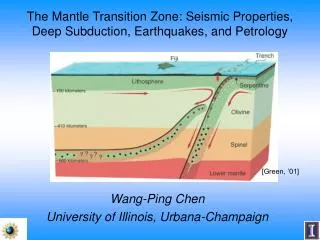
2-D dislocation models for the Sumatra-Andaman Мw 9.2 earthquake of 2004. The profile across the Sumatra Trench at the latitude 3.5°N. (Wang and He, 2008)
15.11.2006 Mw 8.3 earthquake and some aftershocks 13.01.2007 Mw 8.1
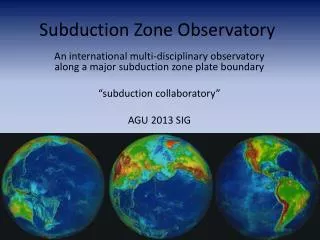
Aftershock epicenters, coseismic displacements and fault plane solutions for the 15.11.2006, Mw 8.3 (а) and 13.01.2007, Mw 8.1 (b) earthquakes. Central Kuril Islands Region. b Pacific Ocean Pacific Ocean 1 – rupture area [Jiet al.,2006, 2007]; 2 – source area by aftershock (mb ≥ 4.5) locations for 10 days after the mainshock occurrence; 3 – coseismic displacements (in m);4 – direction of the maximum displacement in the source;5 – rate and direction of motion of the Pacific plate relative to the Okhotsk plate [Bird, 2003];6 – topography (in m); 7 – axis of the Kuril trench.
Coseismic displacements in the fault plane of 15.11.2006 earthquake (Ch. Ji, 2006)
Distribution of modeled tsunami heights along the Kuril-Kamchatka coast for the 15.11.2006 Mw 8.3 earthquake Tsunami height (m) Kamchatka Tsunami height (m) Sakhalin Tsunami height (m) Hokkaido Tsunami height (m)
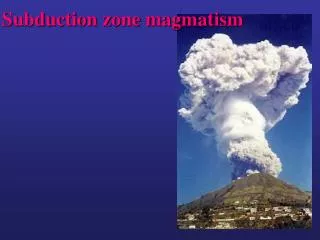
COMMON DYNAMIC APPROACH • To solve the wave equation numerically (using FEM or FBM ) for a specified solid medium and predefined earthquake fault parameters to account for the effects of transient seabed movement (Ohmachi et al., 2001; Dutykh and Dias, 2007, 2008, etc.) • However, it still does not account for the real structure of the lithosphere or the initial state of stress-and-strain in the earthquake source zone
GOAL OF THE WORK • To present some results of numerical modeling of seabed displacements generated by an arbitrarily large subduction zone earthquake • Numerical modeling was performed using the computer code FLAC-3D (Fast Lagrangian Analysis of Continua in 3 Dimensions) (Itasca, 1997)which allowed to model various scenarios of seabed movement in the vicinity of the earthquake source
Forces are fixed during this calculation Strain rates are fixed during this calculation FLAC-3D Each element appears to be physically isolated from its neighbors during one time step • Explicit solution of nonlinear, path-dependent and unstable processes • Explicit finite difference method (FDM ) The calculation cycle
Calculations of stress-and-strain state in the model were performed using the software package FLAC-3D (Itasca, 1997) The yield condition Dryfriction condition
The simple model • The simple model consists of three main zones: • - the frontal arc • - the key-block as a moveable part of frontal arc • - the subducted slab • The material of both the frontal arc and subducted plate is modeled as elastoplastic medium with the Coulomb-Mohr yield criterion, and the interplate contact is modeled as the interface with dry friction • Velocity distribution in the bottom of the moving plate is dictated by the slow relative motion of the underlying mantle • An earthquake occurs when the stress in a local zone of contact surface exceeds the interface strength and the movement along the interface accelerates
Model geometry for calculation of the stress field within a subduction zone
RESULTS • . The results of modeling show that: • (a) sea-bottom displacements in the tsunami source area depend on the interseismic time and the level of stresses achieved prior to the nucleation of seismic motion; these can be highly variable • for short accumulation time and relatively small shear stresses, displacements will be oriented in the direction of the plate motion; otherwise, they will be oriented in the opposite direction. Though the maximum vertical displacement of the sea bottom in both cases will be the same, the generated tsunami waves will be quite different in height, directivity, etc. • (b) transient dynamic component of the vertical sea-bottom displacement can exceed the residual displacement, established after the earthquake, by almost a factor of two • (c) occurrence of the large earthquake and tsunami of 13 January 2007 at the oceanic slope of the Kuril trench can be explained from the modeling by fast and short in time stress redistribution within the subducted slab just after the great event of 15.11.2006, Mw 8.3 at the interplate boundary
Distribution of the principal shear stress for short (а) and long (b) time of model stress accumulation а b
Displacements within the model key-block for short (а) and long (b) time of model stress accumulation
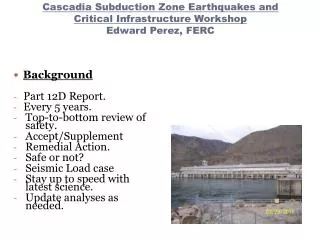
Source contours of the Mw ≥ 8 earthquakes in the Kuril–Kamchatka zone for the period 1900–2005: solid lines – reliable contour lines; dashed lines – assumed contours; numerals - the year of earthquake occurrence. Straight dashed lines - the limits of the seismic gap before 2006 event. Stars - epicenters of the 15.11.2006 and 13.01.2007 earthquakes. Gray rectangles - the contours of source regions of these earthquakes based on the data in [Ji et al., 2006, 2007]. Gray solid line - the axis of the deep Kuril-Kamchatka Trench.
5.0m • Static seabed displacements • in the source: • а – vertical • b– horizontal 4.2m
Vertical seabed displacement in the source of large interplate earthquake Static Т ~ 30 – 50 c Transient oscillations Т ~ 30 – 50 s
Vertical velocity of seabed motion in the source of large interplate earthquake
15.11.2006 г. 13.01.2007 г.
Aftershock epicenters, coseismic displacements and fault plane solutions for the 15.11.2006, Mw 8.3 (а) and 13.01.2007, Mw 8.1 (b) earthquakes. Central Kuril Islands Region. b Pacific Ocean Pacific Ocean 1 – rupture area [Jiet al.,2006, 2007]; 2 – source area by aftershock (mb ≥ 4.5) locations for 10 days after the mainshock occurrence; 3 – coseismic displacements (in m);4 – direction of the maximum displacement in the source;5 – rate and direction of motion of the Pacific plate relative to the Okhotsk plate [Bird, 2003];6 – topography (in m); 7 – axis of the Kuril trench.
DISTRIBUTION OF AFTERSHOCK EPICENTER LOCATIONS ACROSS THE KURIL TRENCH
Conclusions • Computer code FLAC-3D proved to be a valuable tool for studying dynamical seabed motions caused by the great subduction zone earthquakes • Results of numerical modeling with FLAC-3D show that seabed displacements in the tsunami source area depend on the interseismic time and the level of initial stresses achieved prior to the nucleation of seismic motion; these can be highly variable • Transient dynamical component of the vertical seabed displacement can exceed the residual displacement by almost a factor of two • Occurrence of the large earthquake and tsunami of 13.01.2007 at the oceanic slope of the Kuril Trench can be explained by fast and short in time stress redistribution within the oceanic slab just after the great interplate event of 15.11.2006, Mw 8.3