Download
1 / 23
240 likes | 392 Vues
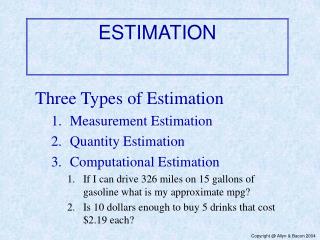
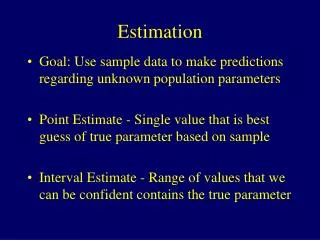
Estimation. Appreciate the importance of random sampling Understand the concept of estimation from samples Understand the Central Limit Theorem Be able to determine unbiased estimates of the variance. What is so important about these words? . Population

E N D
Estimation Appreciate the importance of random sampling Understand the concept of estimation from samples Understand the Central Limit Theorem Be able to determine unbiased estimates of the variance
What is so important about these words? • Population • A Population is the set of all elements of interest for a particular study. Quantities such as the population mean μ are know as population parameters • You can’t normally get information on every element in a population • Sample • A subset of the population. The sample mean , sample statistics & are estimates of the population parameters. • Inferences need to be made from a sample • Vital any sample is representative of the population
If everyone was the same their would be no need for statistics or statisticians!
How will ‘first time’ voters vote?If I take a survey how will I know they are representative? As the sample gets bigger the results should get closer to the population true mean
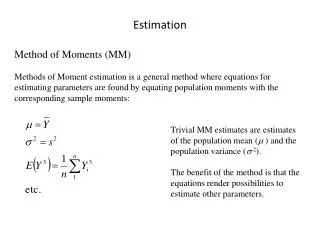
Getting estimates of the mean We have come across estimating means before: Example: Mean height f mid=x f x 160 ≤ x < 165 1 162.5 162.5 165 ≤ x < 170 5 167.5 837.5 170 ≤ x < 175 13 172.5 2242.5 175 ≤ x < 180 10 177.5 1775 180 ≤ x < 185 1 182.5 182.5 Total 30 5200 Estimated mean is 5200 ÷ 30 = 173.3 Or when all values in a set of data are known then the mean of a set is got by
How will they differ from older votersIf I take a survey how will I know they are representative? Is an UNBIASED ESTIMATOR of the population mean μ What inferences can be made from samples and can they be trusted – that is the subject of this lesson.
Which issues concern voters most?If I take a survey how will I know they are representative? In this chapter we learn some statistical magic. The distribution of all sample means is normal, as long as the sample size are large enough. And it doesn't matter what the distribution of the original population looks like. (CLT)
What this means is that we can get an unbiased estimate of the population mean without doing a census The mean of the distribution of sample means is approximately equal to the population mean. Is an UNBIASED ESTIMATOR of the population mean μ
And the distribution of the means is normal That means that the normal distribution tables can be used to solve problems. But first lets
Sample means have standard errors in the same way as population means have standard deviations from the mean. Standard Error of sample means = Standard deviation from population mean
Task EXERCISE B Page 94 Answers page 171
Just as we standardised for a population when the when the mean was not zero and the standard deviation was not one. We standardise samples too but this time we divide by the standard error
IF random samples of size n are taken from a population which can be modelled by a normal distribution N(μ,σ²) then we can assume 3 facts about the sampling distribution • The mean of a sample is μ • The variance of the sampling distribution of is • The sampling distribution of is a normal distribution. • These can be summarised as: • X ̴ N(μ,σ²) then ̴ N(μ, )
Task Follow example 2 & 3 page 96. These give you practice working with samples and the normal distribution and percentage points tables. Then do Exercise C page 97 Always do a sketch of the problem. What you don’t finish in class do for homework.
The Central Limit Theorem (CLT)(Statistical Magic) The CLT says that if a random sample of size n is taken from any distribution (it does not need to be normal) with a mean μ and a variance σ² then, provided n is large enough: This is important as in real life we don’t always know the distribution of the population.
Example 4 (page 100) A packaging machine produces packs of butter with a μ weight of 250g and a σ of 5g. Random samples of 10 packs are taken regularly from the production line and the mean weight of the sample is found. Use the CLT to find the approximate proportion of samples that should have a mean weight > 253g. The distribution of the population is not known but it is implied that n is big enough to use CLT From CLT so sample means follow a normal distribution where the mean is 250 and the standard error is so from the tables Φ(1.90)=0.9713 and since we want the probability of packets being above that we take it away form 1
Task • Exercise D page 100 • Questions 1 to 3 and do the rest for homework
Estimating the Variance All the questions that you have done so far the variance or standard deviation has been know. In most real cases however it wont be known and you will have to use the samples to work out an unbiased estimator of the variance. The unbiased estimator (S2) of the population variance (σ²) from a sample of size n is given by: • Many people get confused when to use n and when to use n-1 as the denominator. • If the data entered is for the whole population use n • If the data entered is for a sample use n-1
Task Exercise E page 104
Warning!!! IF the population distribution is not known and the sample size is less than 30 the normal distribution tables can’t be used. The normal distribution tables can be used if the sample size is grater than 30 (from CLT)
Estimation Appreciate the importance of random sampling Understand the concept of estimation from samples Understand the Central Limit Theorem Be able to determine unbiased estimates of the variance
Task and homework • Exercise F page 106 • Homework mixed questions and test yourself pages 107 & 108