Download
1 / 10
100 likes | 107 Vues
Learn how to make scatter plots, interpret correlations, and write equations of trend lines. Understand the distinction between correlation and causation. Gain insights into real-life scenarios where correlations exist and determine if they imply causation.

E N D
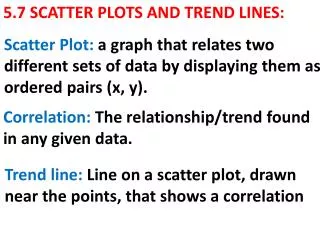
Scatter Plot: A graph that relates two different sets of data by displaying them as ordered pairs
Problem 1: Making a Scatter Plot and Describing its Correlation The table shows the altitude of an airplane and the temperature outside the plane. • Make a scatter plot of the data • What type of relationship does the scatter plot show?
Temperature (F) Altitude (m)
Trend Line: a line on a scatter plot, drawn near the points, that shows a correlation Interpolation: estimating a value between two know values Extrapolation: Predicting a value outside the range of known values
Problem 2: Writing an Equation of a Trend Line Make a scatter plot of the data. What is the approximate weight of a 7-month-old panda
Line of best fit: the trend that shows the relationship between two sets of data Causation: when a change in one quantity causes a change in a second quantity (a correlation between quantities does not always imply causation)
Problem 4: Identifying Whether Relationships are Causal In the following situations, is there likely to be a correlation? If so, does the correlation reflect a causal relationship? Explain? The number of loaves of bread baked and the amount of flour used
In the following situations, is there likely to be a correlation? If so, does the correlation reflect a causal relationship? Explain? The number of mailboxes and the number of firefighters in a city