Hypothesis Test ing (Cont.)
Hypothesis Test ing (Cont.). Null Hypothesis. Decision. True. False. Fail to reject. Type A correct decision. Type II error. H. o. Reject. H. Type I error. Type B correct decision. o. Hypothesis Test Outcomes. Type A correct decision: Null hypothesis true, decide in its favor.

Hypothesis Test ing (Cont.)
E N D
Presentation Transcript
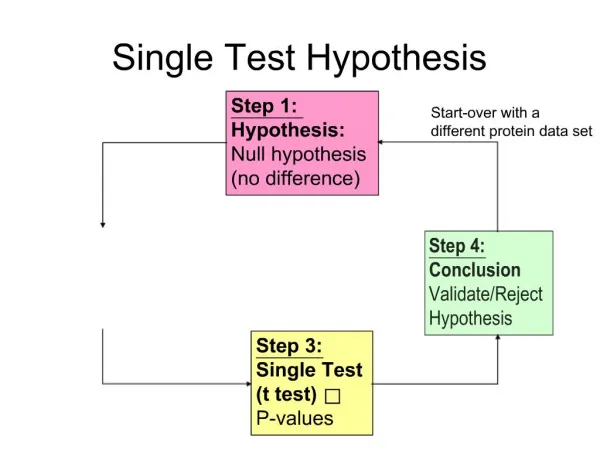
Hypothesis Testing (Cont.) Onur Doğan
Null Hypothesis Decision True False Fail to reject Type A correct decision Type II error H o Reject H Type I error Type B correct decision o Hypothesis Test Outcomes Type A correct decision: Null hypothesis true, decide in its favor Type B correct decision: Null hypothesis false, decide in favor of alternative hypothesis Type I error: Null hypothesis true, decide in favor of alternative hypothesis Type II error: Null hypothesis false, decide in favor of null hypothesis
P = < = < - = > P P ( z z *) P ( z 1 . 58 ) P ( z 1 . 58 ) = - = 0.5000 0 . 4429 0 . 0571 Probability-Value or p-Value Probability-Value, or p-Value: The probability that the test statistic could be the value it is or a more extreme value (in the direction of the alternative hypothesis) when the null hypothesis is true (Note: the symbol P will be used to represent the p-value, especially in algebraic situations)
Critical Value Critical Region Critical Region & Critical Value(s) Illustration:
Decision Rule Decision Rule: a. If the test statistic falls within the critical region, we will reject Ho(the critical value is part of the critical region) b. If the test statistic is in the noncritical region, we will fail to reject Ho a. State the decision about Ho Decision: Fail to reject Ho b. State the conclusion about Ha Conclusion:There is not enough evidence at the 0.05 level of significance to show that the mean weight of boxes is less than 24
Example-1 • Question: The mean water pressure in the main water pipe from a town well should be kept at 56 psi. Anything less and several homes will have an insufficient supply, and anything greater could burst the pipe. Suppose the water pressure is checked at 47 random times. The sample mean is 57.1. (Assume s = 7). Is there any evidence to suggest the mean water pressure is different from 56? Use a = 0.01 Solution: 1. The Set-Up a. Describe the parameter of concern: The mean water pressure in the main pipe b. State the null and alternative hypotheses Ho: m = 56 Ha: m ≠56
3. The Sample Evidence a. The sample information: b. Calculate the value of the test statistic: = = x 57 . 1 , n 47 - m - x 57 . 1 56 = = = z * 1 . 077 s n 7 47 Solution Continued 2. The Hypothesis Test Criteria a. Check the assumptions: A sample of n = 47 is large enough for the CLT to apply b. Identify the test statistic The test statistic is z* c. Determine the level of significance: a = 0.01 (given)
* b. Determine whether or not the calculated test statistic is in the critical region The calculated value of z, z* = 1.077, is in the noncritical region Solution Continued 4. The Probability Distribution a. Determine the critical regions and the critical values
Solution Continued 5. The Results a. State the decision about Ho: Fail to reject Ho b. State the conclusion about Ha: There is no evidence to suggest the water pressure is different from 56 at the 0.01 level of significance
Example-2 A research center concucted that a survey of 985 adults and found that 838 of them know that what Instagram is. Use 0,01 significance level to test the claim that more than 75% of adults know what Instagram is. Onur Doğan
Example-3 • Question:An elementary school principal claims students receive no more than 30 minutes of homework each night. A random sample of 36 students showed a sample mean of 36.8 minutes spent doing homework (assume s = 7.5). Is there any evidence to suggest the mean time spent on homework is greater than 30 minutes? Use α= 0.05 Solution: 1. The Set-Up The parameter of concern: m, the mean time spent doing homework each night Ho: m = 30 (£)Ha: m > 30
3. The Sample Evidence - m - x 36 . 8 30 = = = z * 5 . 44 s n 7 . 5 36 Solution Continued 2. The Hypothesis Test Criteria a. The sample size is n = 36, the CLT applies b. The test statistic is z* c. The level of significance is given: a = 0.01
* The calculated value of z, z* = 5.44, is in the critical region Solution Continued 4. The Probability Distribution
Solution Continued 5. The Results Decision: Reject Ho Conclusion:There is sufficient evidence at the 0.01 level of significance to conclude the mean time spent on homework by the elementary students is more than 30 minutes
PROBABILITY AND STATISTICS WEEK 11 Onur Doğan
S.L. Regression / Least Squares Method Estimation of ErrorVariance
Correlation Coefficient Coefficient of Determination