Hypothesis Tests: Two Related Samples
200 likes | 426 Vues
Hypothesis Tests: Two Related Samples. Related Samples. The same participants give us data on two measures e. g. Before and After treatment Aggressive responses before video and aggressive responses after With related samples, someone high on one measure is probably high on other. Cont.

Hypothesis Tests: Two Related Samples
E N D
Presentation Transcript
Related Samples • The same participants give us data on two measures • e. g. Before and After treatment • Aggressive responses before video and aggressive responses after • With related samples, someone high on one measure is probably high on other. Cont.
Related Samples--cont. • Correlation between before and after scores • Causes a change in the statistic we can use • Sometimes called matched samples or repeated measures
Difference Scores • Calculate difference between first and second score • e. g. Difference = Before - After • Base subsequent analysis on difference scores • Ignoring Before and After data
An Example • Therapy for rape victims • Foa, Rothbaum, Riggs, & Murdock (1991) • One group received Supportive Counseling • Measured post-traumatic stress disorder symptoms before and after therapy
Results • The Supportive Counseling group decreased number of symptoms • Was this enough of a change to be significant? • Before and After scores are not independent. • See raw data • r = .64 Cont.
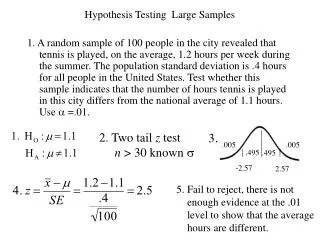
Results--cont. • If no change, mean of differences should be zero • So, test the obtained mean of difference scores against m = 0. • Use same test as in Chapter 12. • We don’t know s, so use s and solve for t
t test D and sD = mean and standard deviation of differences. df = n - 1 = 9 - 1 = 8 Cont.
t test--cont. • With 8 df, t.025 = +2.306 • We calculated t = 6.85 • Since 6.85 > 2.306, reject H0 • Conclude that the mean number of symptoms after therapy was less than mean number before therapy. • Supportive counseling seems to work.
Advantages of Related Samples • Eliminate subject-to-subject variability • Control for extraneous variables • Need fewer subjects
Disadvantages of Related Samples • Order effects • Carry-over effects • Subjects no longer naive • Change may just be a function of time • Sometimes not logically possible
Effect Size Again • We could simply report the difference in means. • Diff = 8.22 • But the units of measurement have no particular meaning to us—Is 8.22 large? • We could “scale” the difference by the size of the standard deviation. Cont.
Effect Size, cont. Cont.
Effect Size, cont. • The difference is approximately 2 standard deviations, which is very large. • Why use standard deviation of Before scores? • Notice that we substituted statistics for parameters.
Interpreting t t(4) = 1.236, p > .05. Do not reject null hypothesis Sample came from population in which mean difference score = 0 IQ scores after taking the pill (M = 102.4) were not significantly higher than IQ scores before taking the pill (M = 99.4), t(4) = 1.24, p > .05.