Download
1 / 6
60 likes | 120 Vues
Conducted a hypothesis test on the percentage of teenage motor vehicle deaths across different time periods from a sample data. Analyzed goodness-of-fit to determine if deaths are uniform across time intervals.

E N D
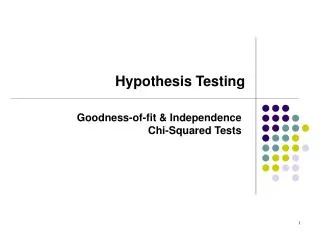
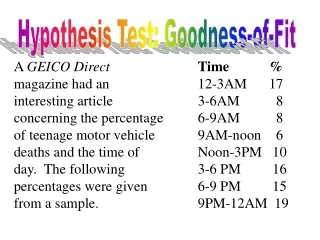
Hypothesis Test: Goodness-of-Fit A GEICO Direct magazine had an interesting article concerning the percentage of teenage motor vehicle deaths and the time of day. The following percentages were given from a sample. Time % 12-3AM 17 3-6AM 8 6-9AM 8 9AM-noon 6 Noon-3PM 10 3-6 PM 16 6-9 PM 15 9PM-12AM 19
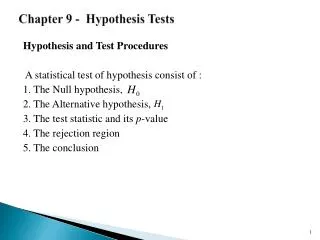
Hypothesis Test: Goodness-of-Fit Is the percentage of teenage motor vehicle deaths the same for each time period? Conduct a hypothesis test at the 1% level. Ho: The percent of teenage motor vehicle deaths is the same for each time period. Ha: The percent of teenage motor vehicle deaths is not the same for each time period.
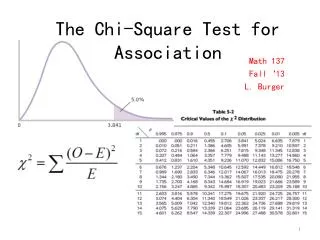
Hypothesis Test: Goodness-of-Fit • The table contains the observed (O) percentages. • If the null hypothesis is true, the expected percentages (E) are 100% divided by 8 time periods or 12.5%. • A Goodness-of-Fit Test is always right-tailed. • The degrees of freedom (df) = n – 1 = 8 – 1 = 7
Hypothesis Test: Goodness-of-Fit • Distribution for the Test: Chi-Square • Mean of the distribution = number of dfs = 7 • To find the test statistic: • Enter Observed values into L1 and Expected values into L2. • Quit out of Edit. Press 2nd, LIST, scroll right to MATH, scroll down to sum(, press Enter. • Type (L1 – L2)^2/L2), Enter. The test statistic is calculated. • To find the pvalue: • Press 2nd, DISTR, scroll down to Chi-Square cdf, press Enter. • Type 13.6,1E99,7), Press Enter. (test statistics, infinity, df) • The pvalue is given.
Hypothesis Test: Goodness-of-Fit Test statistic: 13.6 p-value: 0.0588
Hypothesis Test: Goodness-of-Fit Decision: Do not reject the null hypothesis. Conclusion: There is NOT sufficient evidence to conclude that the percent of teenage motor vehicle deaths is the same for each time period.