Hypothesis test in climate analyses
This document outlines the application of hypothesis tests in climate analyses, focusing on practical insights rather than statistical lectures. Key concepts include the significance level, Type I and Type II errors, and the challenges posed by non-independent and non-identically distributed (non-iid) data. It also examines the detection of anthropogenic climate change through hypothesis testing, emphasizing the importance of considering serial correlation and using advanced techniques like pre-whitening and block-bootstrap methods to improve accuracy in results.

Hypothesis test in climate analyses
E N D
Presentation Transcript
Hypothesis test in climate analyses Xuebin Zhang Climate Research Division
Outline • Application of hypothesis tests in climate analyses, not a lecture of statistics • The statistical test of a hypothesis • Concept, two types of errors • In the case of non-iid • Multiple tests and global significance • Independent tests • Non-independent tests • An application • Detection of anthropogenic climate change
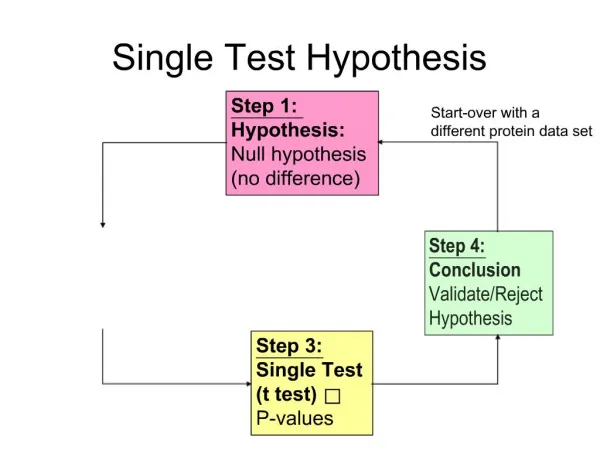
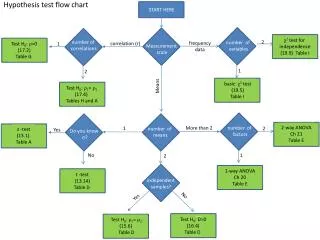
Test of a hypothesis • Null hypothesis H0 • Alternative hypothesis Ha • Two outcomes of a test • Reject H0: we have strong evidence that H0 is false (but does not imply acceptance of Ha) • Failure to reject H0: evidence in the sample not inconsistent with H0 (but does not imply acceptance of H0) • Only consider the case without Ha
The ingredients of a test • A data sample, or observations • Rules for the test: • Observations x, a realization of random vector X • Significance level: the probability of rejecting the H0 when it is true • Test statistic
Type I and type II errors • Type I error • Reject H0 while it is true • Significance level • Type II error • Failure to reject H0 when it is false
An example • Linear regression: • Estimation with least square • Null- hypothesis: H0: • Test statistic:
i.i.d. • A sequence or other collection of random variables is independent and identically distributed (i.i.d.) if each has the same probability distribution as the others and all are mutually independent. • i.i.d. is very common in statistics: observations in a sample are USUALLY assumed to be (more-or-less) i.i.d. for the purposes of statistical inference. • The requirement that observations be i.i.d. tends to simplify the underlying mathematics of many statistical methods. However, in practical applications this is most often not realistic. • We need to pay particular attention on this issue in almost all hypothesis tests
serial correlation has an effect to reduce the number of degrees of freedom Von Storch and Navarra 1995
Solution to serially correlated data • Pre-whitening: removal of serial correlation • Estimate the proper number of DOF • Block-bootstrap • Consider serially explicitly (generalized linear regression
Prewhitening: y(i+1)-alpha*y(i) Von Storch and Navarra 1995
Estimate proper number of degrees of freedom (effective sample size) • Effective time τ between independent samples can be estimated for autoregressive process • Effective sample size n = NΔt/τ • Use n in place of N to compute test statistic/critical value
Block bootstrap • Produce many series that do not have the property (e.g. trend) to be tested by resampling the original series • Keep the serial correlation in the resampled data by resampling the data block by block • Compute the statistics in the resampled data to come up with the critical values of the test statistic
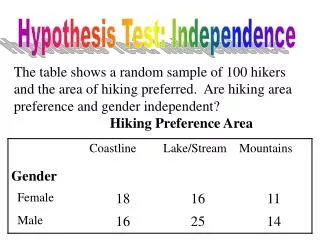
Multiple tests • At multiple locations • On multiple variables of the same system • False rejection with a predefined probability (at the significance level) for each test more tests mean more possible passed tests by chance • Local significance and global (field) significance • Livezey and Chen (1983, MWR)
700 hPa height and SOI Chen 1982
Global significance: independent tests • False rejection expected by chance (at p probability) • Probability of x out of N falsely passed tests follow a binomial distribution • With a limited number of tests, false rejection rate is greaterthan the nominal rate defined by the local significance • How many rejections are needed to claim a global significance? • The significance levels for local and global may differ
Global significance • At p=0.05, there could be 14.1% or more passed tests in 30 tests • Or one needs to obtain more than 14.1% passed test to claim global significance at the 5% level • It takes more than 1000 independent tests in order for the proportion of passed tests close to (but still slightly higher than) the nominal level
Multiple tests: non-independent • Multiple tests are very often not independent • Estimate the proper number of degrees of freedom, use the results for the independent tests • Monte-Carlo simulation
M-C simulation, more details • Repeatedly generate random variables to mimic the SOI index • Random noise • Block Bootstrap to consider serial correlation • AR process • Compute the correlation between 700 hPa height and the generated “soi” indices, and fraction that locally significant correlation has been detected • The fraction corresponding to the pre-defined global significance level is the threshold value with which the correlation with real SOI should be compared
Hypothesis test, summary • Assumptions, assumptions • Two types of errors • Type I: falsely reject the null hypothesis • Type II: unable to reject null hypothesis when it is false • Climate series usually NOT i.i.d. • Local and field significance • Multiple tests usually NOT independent
Climate change detection and attribution • Climate change detection • Complicated hypothesis test involving • Data preprocessing • Formulation of test statistic • Interpolation of test result
Climate change detection • Statistical methods to detect weak climate change signals from noisy background of the incompletely observed climate • Physically based computer models to identify patterns of climate change signals • Statistical inference based on the comparison between observations and model simulated signals (and noise as well)
May be estimated by total least square method Noise of ith signal Detection formalism • Consider uncertainty in the signal
Signal estimates • From ensemble runs • Each run contains signal + noise (natural variability) • Signal is each run is expected to be the same • Noise in each run is not expected to be the same, but the variability of the noise is • Averaging ensemble runs has an effect to keep the signal while reducing the noise level improves S/N ratio and the chance of detection
Noise estimate • One observation sample not sufficient • Estimate from model control runs • Requires very long simulations • Estimate from ensemble runs • Difference between runs reflect natural variability • Remove ensemble mean, residual is noise, need to be careful about the number of degrees of freedom • Detection is conducted at the scale the model simulates high enough variability
www.ec.gc.ca Anthropogenic Influence on Global Precipitation Trend Xuebin Zhang (Environment Canada) Francis Zwiers (Environment Canada) Gabi Hegerl (Duke University) Hugo Lambert (UC Berkeley) Nathan Gillett (CRU, UEA) Susan Solomon (NOAA, USA) Peter Stott (Hadley Centre, UK) Toru Nozawa (Japan National Institute of Environmental Studies)
Observational Data • Global Historical Climate Network (monthly precipitation at 10000+ stations) • Removal of 1961-90 climatology • Station annual anomaly (more than 6 months) • Gridding to 5x5 lat-long grids • Average of available station anomalies within grid
Model simulated data • Anthropogenic forcing (ANT, 8 models, 27runs) • Natural forcing (NAT, V+S, 4 models, 17 runs) • ALL forcing (ANT+NAT) (ALL, 10 models, 50 runs) • HadCM3 1700-yr control run
Detection: Attribution: Detection of anthropogenic signal • Two periods, 75-yr and 50-yr • 10-degree Latitudinal trends • Total least square
Precipitation variability • Overestimation from station data • Smaller model variability when compared with obs based estimate • EOF truncation of observed and modeled trend • Conservative detection result
EOF truncation: detection at scale simulated variability ~ observed variability
Summary: detection for precipitation trend • Anthropogenic signal detectable in zonal precipitation trend • ALL signal detectable • ANT signal detectable • NAT not detectable • First work, with limitations • Obs data • Mismatch in obs and model based variability estimates • Extreme may be more promising, but also limited by obs data • Paper published in Nature July 26 (doi:10.1038/nature06025)