Scrutinising Performance
Scrutinising Performance. Peter Watt INLOGOV, July 2007 http://www.inlogov.bham.ac.uk/staff/wattp /. Contents. What is performance 3 Es, Performance improvement, Gershon Achieving performance improvement – information problems and performance indicators


Scrutinising Performance
E N D
Presentation Transcript
Scrutinising Performance Peter Watt INLOGOV, July 2007 http://www.inlogov.bham.ac.uk/staff/wattp/
Contents • What is performance • 3 Es, Performance improvement, Gershon • Achieving performance improvement – information problems and performance indicators • Making scrutiny of performance a success
Fundamental performance objectives • Why produce? • To generate consumer/customer/user/client satisfaction/happiness • Inputs Outputs Outcomes Labour, Home Listening Materials audio experience system Valuing production = Valuing contribution to consumer satisfaction Output x (marginal) valuation of output (quantity x price) (Or outcome x (marginal) valuation of outcome)
The public sector production process – e.g. road repairs Inputs Outputs Outcomes Number of checks of roads, number and size of repairs Free flowing traffic in the local authority area Staff, machinery, materials Reference: Stevens, P.A. (2005) “Assessing the performance of Local Government,” National Institute Economic Review, 193, July, pp. 90-101.
Valuing public sector production Inputs Outputs Outcomes Production = Total value of outputs = value of a unit of output x quantity of outputs Production = Total value of outputs = marginal value of a unit of outcome x quantity of outcomes Total value of inputs = prices of inputs x quantity of inputs = budget Known Not known Not known
Value of production • Private sector Output x value of output = outcome x value of outcome Units x price not known x not known known known • Public sector Output x value of output = outcome x value of outcome not known x not knownnot known x not known
Why the emphasis on outcomes rather than outputs in the public sector? • Outcomes are actually what is required • Outputs are only a means to an end • If productivity is measured via outputs then the nature of the outputs could start to change and lose their link with outcomes • In the private sector this is prevented as each outputs has to be sold to a willing buyer
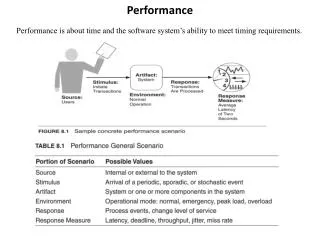
Performance • Improving economy, efficiency and effectiveness
Economy • Economy means acquiring the necessary resources (finance, staff, buildings, equipment, etc.) to carry out an activity at the least cost. • Minimising the cost of resources used for an activity, having regard to the appropriate quality.
Efficiency • Efficiency means achieving maximum output from a given level of resources used to carry out an activity. • The relationship between the output, in terms of goods, services or other results, and the resources used to produce them.
Effectiveness • Effectiveness means the extent to which the activity's stated objectives have been met. • The extent to which objectives are achieved and the relationship between the intended impact and the actual impact of an activity.
The local authority production process Inputs Outputs Outcomes Economy - obtain inputs at a minimum cost for a given level of output at a defined quality Efficiency - maximise outputs for a given level of inputs Effectiveness - what is the end result of applying the outputs
Performance measures related to health production process stages • Economy • E.g. Cost of drugs for a treatment • Efficiency • For given hospital facilities and standards of care, how many patients are being treated • Effectiveness • Did treatment lead to increased life years of a given quality? HM Treasury (2001) Choosing the right Fabric, http://www.hm-treasury.gov.uk/media/BB5BC/229.pdf
X Performance improvement “the balance between cost and quality that local people want economical, efficient and effective service delivery continuous improvement” Improvement in performance indicators continuous improvement quality cost
Baumol’s disease Baumol’s disease – the problem of low productivity growth in labour intensive industries. ttp://nces.ed.gov/pubs97/97535/97535k.asp (Scroll down to section on Baumol’s disease) The original article by Baumol: Baumol, W. J. (1967). Macroeconomics of unbalanced growth: the anatomy of urban crisis. American Economic Review, 57, 415-426
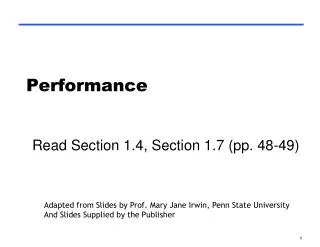
Gershon efficiencies Outputs E3 E4 O E1, E2 ● X “minus” E4 I Inputs
Gershon efficiencies • 2.5% per annum on 2004/5 baseline for 2005/06, 2006/07, 2007/08 • Efficiencies defined as • (E1) reducing inputs (money, people, assets, etc) for the same outputs; • (E2) reducing prices (procurement, labour costs, etc) for the same outputs; • (E3) getting greater outputs or improved quality (extra service, productivity, etc) for the same inputs; or • (E4) getting more outputs or improved quality in return for an increase in resources that is proportionately less than the increase in output or quality.” • Not • Re-labelling of activity – e.g. reclassifying inspection as advice • Cuts that result in poorer services for the public • Increased income purely from higher prices in fees and charges to the public http://www.localegov.gov.uk/images/Efficiency%20Technical%20Note%20(ETN)%20for%20Local%20Government_229.pdf
Gershon – cashable efficiency gains • Cashable gains represent the potential to release resources for reallocation elsewhere. By contrast, non-cashable gains are achieved through such means as improved quality or additional outputs for the same level of resources. • Procurement efficiency gains realised through greater economies of scale or lower prices are cashable. This includes instances where prices have been negotiated to below the level of inflation. Where higher quality goods and services are procured for the same prices (after allowing for inflation), gains are non-cashable; • Corporate services will be cashable for those cases of less expenditure for the same outcomes, non-cashable where better outcomes are achieved for the same expenditure; • Transactions follows the same approach as corporate services. In the case where improved output is claimed, it must be clear that the improved output is genuinely beneficial to the end user;
Gershon efficiencies • 2.5% per annum on 2004/5 baseline for 2005/06, 2006/07, 2007/08 • Efficiencies defined as • (E1) Reducing inputs for same outputs • (E2) Reducing prices (procurement costs, labour costs etc for same inputs • (E3) Getting greater outputs or improved quality for the same inputs • (E4) Getting more outputs or improved quality in return for an increase in resources that is proportionately less than the increase in output or quality • Not • Re-labelling of activity – e.g. reclassifying inspection as advice • Cuts that result in poorer services for the public • Increased income purely from higher prices in fees and charges to the public http://www.localegov.gov.uk/images/Efficiency%20Technical%20Note%20(ETN)%20for%20Local%20Government_229.pdf • “having established the baseline savings ambition for the 2007 CSR period of 3 percent per year across central and local government, this Budget confirms that all of these savings will be net and cash-releasing, thereby maximising the resources available to improve frontline services and fund new priorities – HM Treasury, Budget 2007, March 2007, p. 139 • [The 2007 CSR will set departmental spending plans and priorities for the years 2008-09, 2009-10 and 2010-11]
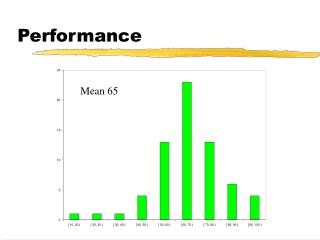
Performance v Cost Average Low cost, high performance P e r f o r m a n c e High cost, low performance Unit Cost
Warwickshire County Council Resources
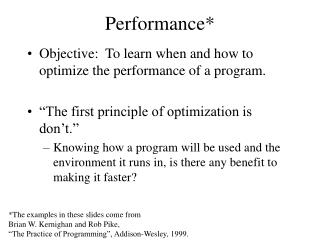
Agent Principal Payment Effort Getting performance – the problem of agency • The problem of getting someone, or some organisation to do something for you • In return for payment, you want effort, results, outcomes, or monitoring information about what has been delivered: - an account
Principal Citizen Politicians Central Government LA political leader Agent Government (Politicians) Staff Local Government LA staff Principal agent problems in the public sector
Agent Principal/ scrutineer Payment Effort Scrutinising for performance Monitoring/information
Agent Principal Payment Effort Agent Principal Payment Effort Divergence of interestsPrincipal would like: Agent would like:
Problems for the principal/scrutineer: information asymmetry: hidden information and hidden action • The agent will often know better than the principal how suitable the are for the job (the adverse selection problem) • E.g. the agent may know of a better agent than themselves, but can they be expected to tell the client that? • The agent will often have better information than the principal on how well they are carrying out the task/how much effort they are making (the moral hazard problem) • E.g. the agent may make less effort than they have led the principal to believe • These are examples of information asymmetry
Some possible solutions to information problems • do it yourself? • trust? • get independent information • align incentives? • competition? • performance indicators?
Controlling experts • Separation of diagnosis and treatment • Independent information - consultants • Effective, but may be too costly if there are economies of scope • Corresponds to the client-contractor split in local government • Advantage – works against services being provider-led • Disadvantage – may be too costly
Transport Meeting local transport needs more effectively – improved access to jobs and services, particularly for those most in need; improved public transport and safety; reduced congestion and pollution. Issues Overarching outcomes Accessibility The local community, and in particular disadvantaged or vulnerable groups, have access to work and important services including education, healthcare, leisure and shopping. Managing externalities Congestion does not hinder economic development or impair the quality of the local environment. Reductions in the numbers killed and seriously injured in road traffic accidents and reductions in the impact of road traffic accidents on specific communities (for example, socio-economic groups). The environmental impact of transport, including air quality, noise and climate change, is minimised. From CPA 2005 The Way Ahead Audit Commission http://www.audit-commission.gov.uk/reports/NATIONAL-REPORT.asp?CategoryID=PRESS-CENTRE&ProdID=AC744231-8175-4d1a-A5F6-28FFED3B235A&fromPress=NATIONAL-REPORT&SectionID=subsect5#target4
Performance indicators • Audit Commission advises that PI’s should be SMART (specific, measurable, achievable, relevant and time-bound) • A SMART target might be ‘to ensure that between the hours of 7 am and 11 pm on Monday to Saturday, levels of litter and detritus in the central retail area do not rise above level B (as defined in BVPI 199), through inspecting levels of litter and detritus on an hourly basis’. • Audit Commission Setting Priorities and Maintaining Focus, http://www.audit-commission.gov.uk/reports/accessible.asp?ProdID=04427960-AAE1-11d7-B316-0060085F8572
Performance information • HM Treasury advises that performance information should be FABRIC • Focused on the organisation’s aims and objectives; • Appropriate to, and useful for, the stakeholders who are likely to use it; • Balanced, giving a picture of what the organisation is doing, covering all significant areas of work; • Robust in order to withstand organisational changes or individuals leaving; • Integrated into the organisation, being part of the business planning and management processes; and • Cost Effective, balancing the benefits of the information against the costs. HM Treasury (2001) Choosing the right Fabric, http://www.hm-treasury.gov.uk/media/BB5BC/229.pdf
Problems with performance measures • Tunnel vision • Suboptimisation • Myopia • Measure fixation • Misrepresentation • Gaming • Ossification Smith, P “On the unintended consequences of publishing performance data in the public sector” Int Jnl of Public Admin, 1995
Problems with performance management • The “success indicator” problem:- “Another month’s production target successfully completed comrade!” • A problem with output accountability is the general difficulty of measuring outcomes, and the possible operation of Goodhart’s Law (Goodhart, 1975) whereby “any observed statistical regularity will tend to collapse once pressure is placed upon it for control purposes.” In other words, there is a danger that outcomes may be “faked”. Goodhart, C. (1975) ‘Problems of monetary management: The U.K. experience’, in: Courakis, A. S. (ed), (1981) Inflation, Depression and Economic Policy in the West • Performance indicators as “signals”
“Who needs a nail as big as that?” “Who cares – the important thing is that it has fulfilled the production target in one fell swoop!”
Performance indicators as “signals” “Leaping in impalas reduced flight speeds and was an honest signal of the performer's physical condition. Bounding was used by many species to clear obstacles. Stotting carried a time cost and it too signalled the prey's physical condition”. Ungulate Antipredator Behavior - Preliminary And Comparative Data From African Bovids, Caro TM, Behaviour,128: 189-228, Part 3-4, MAR 1994
Making scrutiny of performance a success issues • Performance reports – comprehendability – need to evolve with member involvement • Need for clarity in constitution on whether scrutiny has responsibility for performance • Reports structured around achieving corporate priorities • Time at beginning of meetings to agree approach – allocate tasks and roles • Time at end to reflect on whether objectives have been achieved