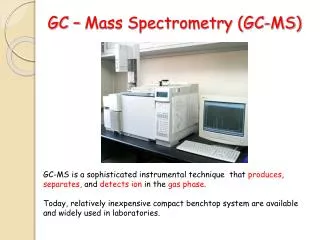
A Simple Model of GC x GC Separations
390 likes | 1.22k Vues
A Simple Model of GC x GC Separations John V. Seeley Oakland University 3/6/07 Model Goals Generation of a “Simplified Chromatogram” from: 1-D retention times Linear free energy relationship parameters Retention indices Utility of the “Simplified Chromatogram”

A Simple Model of GC x GC Separations
E N D
Presentation Transcript
A Simple Model of GC x GC Separations John V. Seeley Oakland University 3/6/07
Model Goals • Generation of a “Simplified Chromatogram” from: • 1-D retention times • Linear free energy relationship parameters • Retention indices • Utility of the “Simplified Chromatogram” • Demonstrates the underlying mechanisms of a GC x GC separation • Approximate representation of relative peak position • Quick screening new column sets • Demonstrates the influence of stationary phase order on chromatogram structure • Demonstrates the concept of “orthogonality” in GC x GC
Model Goals • The model does not attempt to: • Predict absolute retention times (just relative retention position) • Predict peak widths • Find optimal flow, temperature, modulation conditions, and/or column dimensions • Generate accuracy at the cost of convenience
Conclusions Based on the 3-Step Solvation Model Retention Ordera –DGo Retention Ordera (Solvent Cohes. – Constant) (Solute Size) + (Solvent Polarity) (Solute Polarity) Retention Ordera (Solute Size) + [(Solvent Polarity)/(Solvent Cohes. – Constant)] (Solute Polarity) Big Conclusions: Solute Size should have a “universal” impact on retention order Solute Polarity will have an impact that is separable from Solute Size The impact of Solute Polarity will depend on Solvent Polarity and Solvent Cohes.
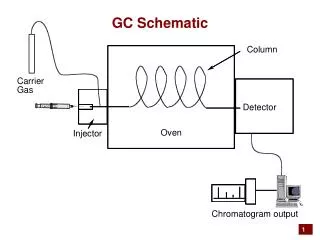
The “Logic” Behind a 2-D Chromatogram • GC x GC Chromatograms generate separations in two dimensions one dimension is primarily a “size” separation one dimension is primarily a “polarity” separation • Mixtures of monofunctional homologous organic compounds of the type Z – (CH2)n – H are the simplest samples to demonstrate the nature of GC x GC separations. Size determined by n and Z Polarity determined by Z
A GC x GC Chromatogram of Several Series of Homologous Compounds DB-624 x DB-Wax
A GC x GC Chromatogram of Several Series of Homologous Compounds Increasing n • Fairly flat bands • Uniform vertical structure for different values of n
Observations of Chromatogram Structure • Each homolgous group (i.e., each Z) has a different starting primary retention time. Changing the value of n leads to a shift in primary retention time that is independent of Z. This suggests the use of a retention index, r, that is linearly related to n and has a Z-dependent offset, rz. r = n + rz rZ is a unique constant for each functional class and each column 1tR = f (r) f = monotonically increasing function • Compounds of the same functional class generate peaks in a horizontal band. This means secondary retention time is independent of n and most likely determined by the rz factors on the primary and secondary column.
Determination of rZ • We would like to be able to determine the values of rz for a wide variety of functional groups on a wide range of columns. • There are many possible sources of data that can be used to determine rz, but temperature-programmed 1-D GC data is probably the most plentiful. • For this study we primarily use 1-D GC-MS Data • DB-624 (30m x 250 mm x 1.4 mm) • DB-Wax (30m x 250 mm x 0.25 mm) • DB-210 (30m x 250 mm x 0.5 mm) • Experimental Conditions: • Constant flow = 1 mL/min He • Temp. Program: 35 oC for 4 min; 5 oC/min to 200 oC; Hold for 10 min.
Determination of rZ • rz provides information on the significance of dispersive and polar interactions between the stationary phase and the functional group Z. • We define rZ = 0 for n-alkanes. • Plot tR vs. n for several homologous sets including alkanes and horizontally shift the homologous sets achieve maximum alignment. The value of the shift is defined to be rz. • Once rz is determined. The value of the retention index r is known for each member of the homologous set using r = n + rz . • The retention index r is essentially a nonparametric, diversely defined, divided by 100, temperature-programmed Kovats retention index.
Determination of rZ ClassrZ Alkanes0 Alkenes 0 Cyclohexanes 0 2-ketones0 Aromatics0 Acetates0 Aldehydes0 1-chloros0 1-alcohols0 2-alcohols0 tert-alcohols0
Determination of rZ ClassrZ Alkanes0 Alkenes 1.97 Cyclohexanes 6.27 2-ketones4.35 Aromatics6.85 Acetates4.45 Aldehydes3.40 1-chloros2.72 1-alcohols4.17 2-alcohols4.46 tert-alcohols4.81
Determination of rZ • Alignment analysis was repeated with data from: • catalog retention times • columns with different dimensions (same stationary phase) • diverse temperature programs • variability rz values was on the order of +/- 0.1 • alignment analysis generates comparable fits for other commonly used stationary phases including DB-1, DB-1701, HP-5, and HP-50+
rZ & n – Relationship to 2D Chromatogram Initial study focused on determining the rz values of 11 different compound classes.
rZ & n – Relationship to 2D Chromatogram The primary retention time is essentially linearly related to n + rZ. 1tRa (rZ + n)
rZ & n – Relationship to 2D Chromatogram Examine the secondary retention of a small region of the 2D chromatogram
rZ & n – Relationship to 2D Chromatogram The secondary retention time is exponentially related to DrZ. 2tRa (exp DrZ) where Drz = 2rz – 1rz
Definition of the Simplified Chromatogram • Our goal is to generate a 2D retention time plot with “structure” that is similar to the real GC x GC chromatogram. • 1tR proxy: 1r = 1rz + n • 2tR proxy: ADrz Drz = 2rz - 1rz A is a constant between 1.5 and 1.8 Thus, the simplified chromatogram is generated from 1-D retention indices and a single, narrowly defined constant (A).
An Application of the Simplified Chromatogram: Changing Stationary Phase Order
An Application of the Simplified Chromatogram: Changing Stationary Phase Order
An Application of the Simplified Chromatogram: Changing Stationary Phase Order Key Results Simplified chromatograms for both column orders (i.e., non-polar x polar and polar x non-polar) are generated with the same sets of rz values. The simplified chromatograms “capture the essence” of the retention positions in both configurations. Thus, switching stationary phase order leads to a simple, predictable change in peak positions: logarithmic warping of the primary retention time inversion of secondary retention time Comparable results are obtained with the DB-1 & HP-50+ column set.
An Application of the Simplified Chromatogram: Predicting the Retention Position of Non-Homologous Compounds The simplified chromatogram concept can be easily extended to non-homologous mixtures provided that the retention indices of the mixture compounds are known. We have fit our plots of tR vs (rz + n) with an asymmetric sigmoid function. This function can then be inverted to calculate the retention index of any compound (homologous or non-homologous) from its retention time. Retention indices on primary and secondary columns can be combined to generate a simplified chromatogram. 1tR proxy: 1r 2tR proxy: ADr
Alcohol Mixture r values are calculated from the curve fits. Excellent prediction of peak position
Aromatic Mixture Excellent prediction of relative retention of non-homologous compounds
Aromatic/Alcohol Mixture Great intra-group predictions Poor inter-group predictions. This is due to the extreme structural differences between the two groups.
A Linear Free Energy Model of GC x GC Separations Simple models that predict retention from a linear combination of solute descriptors and corresponding stationary phase descriptors have been the subject of numerous studies over the past 40 years. The linear free energy model originally developed by Abrahams et al. has been adopted by several research groups. Descriptors are available for over 1000 solutes. Poole et al. have published the descriptors of most of the commonly used capillary column stationary phases. Poole et al. are currently revising the solute and stationary phase descriptors for improved accuracy.
Polarity of Functional Group r = n + nz + s’S + e’E + a’A Compound size
Definition of the LFER Simplified Chromatogram • 1tR proxy: 1r = n + nz + 1s’ S + 1e’ E + 1a’ A • 2tR proxy: ADr Dr = 2r - 1r = Ds’ S + De’ E + Da’ A A is a constant between 1.5 and 1.8 Thus, the primary dimension is influenced by size and polarity, while the secondary dimension is only influenced by polarity.
LFER Studies LFER simplified chromatograms are surprisingly accurate. Comparable results were obtained for HP-5 x DB-Wax, DB-Wax x HP-5, DB-1 x HP-50, and HP-50 x DB-1. The LFER model shows that relative primary retention is dictated by compound size and column specific polarity. The relative secondary retention is dictated by the difference in the column specific polarity between the primary column and the secondary column (compound size does not matter). The notion of a non-polar x polar separation as being “orthogonal” is not entirely accurate. While the secondary dimension is orthogonal to compound size, the primary dimension is not orthogonal to compound polarity (I.e., compound polarity plays a role in the primary retention). Thus, the two dimensions are not orthogonal to one another. Actually, a lack of orthogonality is not a bad thing; especially, when trying to separate compounds with similar size.
Main Conclusions The retention index of a compound can be expressed as a linear combination of a size descriptor and and a column-specific polarity descriptor. The retention indices (and/or the size and polarity descriptors) of compounds can be determined from temperature-programmed, 1-D GC runs. Such retention indices can be combined in a straightforward fashion to generate a simplified chromatogram. The simplified 2-D chromatogram is a surprisingly accurate representation of the structure of the chromatogram. Linear free energy parameters can be incorporated into the simplified chromatogram concept to generate a flexible tool for retention time prediction. The accuracy won’t be great, but it will be useful for screening column sets and stationary phase order. The notion of “orthogonality” in GC x GC has been misused and over-hyped.