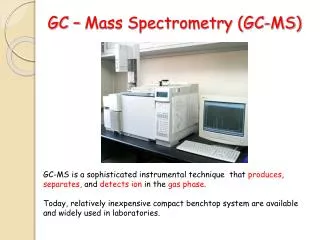
GC – Mass Spectrometry (GC-MS)
930 likes | 2.33k Vues
GC – Mass Spectrometry (GC-MS). GC-MS is a sophisticated instrumental technique that produces , separates, and detects ion in the gas phase . Today, relatively inexpensive compact benchtop system are available and widely used in laboratories. GC – Mass Spectrometry (GC-MS).

GC – Mass Spectrometry (GC-MS)
E N D
Presentation Transcript
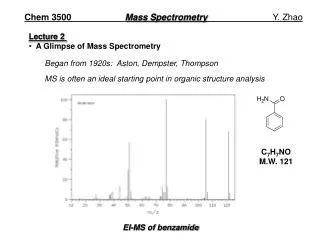
GC – Mass Spectrometry (GC-MS) GC-MS is a sophisticated instrumental technique that produces, separates, and detects ion in the gas phase. Today, relatively inexpensive compact benchtop system are available and widely used in laboratories.
GC – Mass Spectrometry (GC-MS) • Mass spectroscopy is used to determine the molecular formula of the unknown compound. • Mass spectroscopy data that provides structural information tends to be unreliable and thus will only be used to verify a possible structure or in the event that the other spectral techniques are unsuccessful.
Principle of GC-MS Block diagram of mass spectroscopy
The inlet transfers the sample into the vacuum of the mass spectrometer. In the source region, neutral sample molecules are ionized and then accelerated into the mass analyzer. • The mass analyzer is the heart of the mass spectrometer. This section separates ions, either in space or in time, according to their mass to charge ratio. • After the ions are separated, they are detected and the signal is transferred to a data system for analysis. • All mass spectrometers also have a vacuum system to maintain the low pressure, which is also called high vacuum, required for operation. • High vacuum minimizes ion-molecule reactions, scattering, and neutralization of the ions. • In some experiments, the pressure in the source region or a part of the mass spectrometer is intentionally increased to study these ion-molecule reactions. Under normal operation, however, any collisions will interfere with the analysis.
Electron Impact (EI) Electron Ionization (EI) is the most common ionization technique used for mass spectrometry. EI works well for many gas phase molecules, but it does have some limitations. Although the mass spectra are very reproducible and are widely used for spectral libraries, EI causes extensive fragmentation so that the molecular ion is not observed for many compounds. Fragmentation is useful because it provides structural information for interpreting unknown spectra.
Electron Ionization Process A) Ionizing electron approaches the electron cloud of a molecule B)Electron cloud distorted by ionizing electron C) Electron cloud further distorted by ionizing electron
D) Ionizing electron passes by the molecule E) Electron cloud of molecule ejecting an electron F) Molecular ion and ejected electron.
Chemical Ionization Chemical Ionization (CI) is a “soft” ionization technique that produces ions with little excess energy. As a result, less fragmentation is observed in the mass spectrum. Since this increases the abundance of the molecular ion, the technique is complimentary to 70 eV EI. CI is often used to verify the molecular mass of an unknown. Only slight modifications of an EI source region are required for CI experiments.
In Chemical Ionization the source is enclosed in a small cell with openings for the electron beam, the reagent gas and the sample. The reagent gas is added to this cell at approximately 10 Pa (0.1 torr) pressure. This is higher than the 10-3 Pa (10-5 torr) pressure typical for a mass spectrometer source. At 10-3 Pa the mean free path between collisions is approximately 2 meters and ion-molecule reactions are unlikely. In the CI source, however, the mean free path between collisions is only 10-4 meters and analyte molecules undergo many collisions with the reagent gas. The reagent gas in the CI source is ionized with an electron beam to produce a cloud of ions. The reagent gas ions in this cloud react and produce adduct ions like CH5+,which are excellent proton donors.
When analyte molecules (M) are introduced to a source region with this cloud of ions, the reagent gas ions donate a proton to the analyte molecule and produce MH+ ions. The energetic of the proton transfer is controlled by using different reagent gases. The most common reagent gases are methane, isobutane and ammonia. Methane is the strongest proton donor commonly used with a proton affinity (PA) of 5.7 eV. For softer ionization, isobutane (PA 8.5 eV) and ammonia (PA 9.0 eV) are frequently used. Acid base chemistry is frequently used to describe the chemical ionization reactions. The reagent gas must be a strong enough Brønsted acid to transfer a proton to the analyte. Fragmentation is minimized in CI by reducing the amount of excess energy produced by the reaction. Because the adduct ions have little excess energy and are relatively stable, CI is very useful for molecular mass determination.
Mass Analyzer After ions are formed in the source region they are accelerated into the mass analyzer by an electric field. The mass analyzer separates these ions according to their m/z value. The selection of a mass analyzer depends upon the resolution, mass range, scan rate and detection limits required for an application. Each analyzer has very different operating characteristics and the selection of an instrument involves important tradeoffs.
Quadrapole Mass Filter The quadrupole mass spectrometer is the most common mass analyzer. Its compact size, fast scan rate, high transmission efficiency, and modest vacuum requirements are ideal for small inexpensive instruments. It ‘filter’ and only allow specific ions to pass. Most quadrupole instruments are limited to unit m/z resolution and have a mass range of m/z 1000. Many benchtop instruments have a mass range of m/z 500 but research instruments are available with mass range up to m/z 4000.
Quadrapole Mass Analyzer • Only compound with specific m/z ratio will resonate along the field (stable path) • Achieved by rapidly varying the voltage
Time of Flight Analyzer The time-of-flight (TOF) mass analyzer separates ions in time as they travel down a flight tube. This is a very simple mass spectrometer that uses fixed voltages and does not require a magnetic field. The greatest drawback is that TOF instruments have poor mass resolution, usually less than 500. These instruments have high transmission efficiency, no upper m/z limit, very low detection limits, and fast scan rates. For some applications these advantages outweigh the low resolution. Recent developments in pulsed ionization techniques and new instrument designs with improved resolution have renewed interest in TOF-MS.
This picture shows the working principle of a linear time of flight mass spectrometer. To allow the ions to fly through the flight path without hitting anything else, all the air molecules have been pumped out to create an ultra high vacuum. Ions of different m/z ratio travel at different velocities. The difference in arrival times separate two (or more) ions.
Graph of ion intensity versus mass-to-charge ratio (m/z) (units daltons, Da)
High Performance Liquid Chromatography http://www.waters.com/WatersDivision/ContentD.asp?watersit=JDRS-6UXGYA&WT.svl=1
Liquid Chromatography • Chromatography in which the mobile phase is a liquid. • The liquid used as the mobile phase is called the “eluent”. • The stationary phase is usually a solid or a liquid. • In general, it is possible to analyze any substance that can be stably dissolved in the mobile phase.
Column Chromatography and Planar Chromatography Separation column Paper or a substrate coated with particles Packing material Paper Chromatography Thin Layer Chromatography (TLC) Column Chromatography
Separation Process and Chromatogram for Column Chromatography Chromatogram Output concentration Time
Chromatogram tR tR : Retention time Peak Intensity of detector signal t0 t0 : Non-retention time h A : Peak area A h : Peak height Time
From Liquid Chromatography to High Performance Liquid Chromatography • Higher degree of separation! Refinement of packing material (3 to 10 µm) • Reduction of analysis time! Delivery of eluent by pump Demand for special equipment that can withstand high pressures The arrival of high performance liquid chromatography!
Flow Channel Diagram for High Performance Liquid Chromatograph Detector Column Column oven (thermostatic column chamber) Pump Sample injection unit (injector) Drain Eluent (mobile phase) Data processor Degasser http://www.lcresources.com/resources/getstart/2c01.htm
What’s the different between HPLC and GC? • Solvent Delivery Pump • A solvent delivery pump that can maintain a constant, non-pulsating flow of solvent at a high pressure against the resistance of the column is required. • Sample Injection Unit • There is a high level of pressure between the pump and the column; a device that can inject specific amounts of sample under such conditions is required. • Column • The technology for filling the column evenly with refined packing material is required. Also, a material that can withstand high pressures, such as stainless steel, is required for the housing. • Detector • Higher degrees of separation have increased the need for high-sensitivity detection, and levels of sensitivity and stability that can respond to this need are required in the detector.
Detection in HPLC *There are six major HPLC detectors: • Refractive Index (RI) Detector • Evaporative Light Scattering Detector (ELSD) • UV/VIS Absorption Detectors • The Fluorescence Detector • Electrochemical Detectors (ECDs) • Conductivity Detector * The type of detector utilized depends on the characteristics of the analyte of interest. http://www.waters.com/WatersDivision/Contentd.asp?watersit=JDRS-6UXGZ4
Refractive Index Detector • Based on the principle that every transparent substance will slow the speed of light passing through it. • Results in the bending of light as it passes to another material of different density. • Refractive index = how much the light is bent • The presence of analyte molecules in the mobile phase will generally change its RI by an amount almost linearly proportional to its concentrations. http://farside.ph.utexas.edu/teaching/302l/lectures/img1154.png
Refractive Index Detector • Affected by slight changes in mobile phase composition and temperature. • Universal-based on a property of the mobile phase • It is used for analytes which give no response with other more sensitive and selective detectors. • RI = general • responds to the presence of all solutes in the mobile phase. • Reference= mobile phase • Sample= column effluent • Detector measures the differences between the RI of the reference and the sample. http://hplc.chem.shu.edu/HPLC/index.html
Evaporative Light Scattering Detector (ELSD) • Analyte particles don’t scatter light when dissolved in a liquid mobile phase. • Three steps: 1) Nebulize the mobile phase effluent into droplets. • Passes through a needle and mixes with hydrogen gas. 2) Evaporate each of these droplets. • Leaves behind a small particle of nonvolatile analyte 3) Light scattering • Sample particles pass through a cell and scatter light from a laser beam which is detected and generates a signal. http://www.sedere.com/WLD/whatis.html
UV/VIS Absorption Detectors • Different compounds will absorb different amounts of light in the UV and visible regions. • A beam of UV light is shined through the analyte after it is eluted from the column. • A detector is positioned on the opposite side which can measure how much light is absorbed and transmitted. • The amount of light absorbed will depend on the amount of the compound that is passing through the beam. http://www.chemguide.co.uk/analysis/chromatography/hplc.html
UV/VIS Absorption Detectors • Beer-Lambert law: A=εlc, • A= absorbance,ε=molar absortivity, l=length of solution that light pass thru, c=concentration • absorbance is proportional to the compound concentration. • Fixed Wavelength: measures at one wavelength, usually 254 nm • Variable Wavelength: measures at one wavelength at a time, but can detect over a wide range of wavelengths • Diode Array Detector (DAD): measures a spectrum of wavelengths simultaneously
The Fluorescence Detector • Measure the ability of a compound to absorb then re-emit light at given wavelengths • Some compounds will absorb specific wavelengths of light which, raising it to a higher energy state. • When the compound returns to its ground state, it will release a specific wavelength of light which can be detected. • Not all compounds can fluoresce / more selective than UV/VIS detection. http://mekentosj.com/science/fret/images/ fluorescence.jpg
Electrochemical Detectors (ECDs) • Electrochemical Detectors (ECDs): • Used for compounds that undergo oxidation/reduction reactions. • Detector measures the current resulting from an oxidation/reduction reaction of the analyte at a suitable electrode. • Current level is directly proportional to the concentration of analyte present. • Conductivity Detector: • Records how the mobile phase conductivity changes as different sample components are eluted from the column. http://hplc.chem.shu.edu/HPLC/index.html http://hplc.chem.shu.edu/HPLC/index.html
Types of HPLC • There are numerous types of HPLC which vary in their separation chemistry. • All chromatographic modes are possible: • Ion-exchange • Size exclusion • Also can vary the stationary & mobile phases: • Normal phase HPLC • Reverse phase HPLC
Chromatographic Modes of HPLC • Ion exchange: • Used with ionic or ionizable samples. • Stationary phase has a charged surface. • opposite charge to the sample ions • The mobile phase = aqueous buffer • The stronger the charge on the analyte, the more it will be attracted to the stationary phase, the slower it will elute. • Size exclusion: • Sample separated based on size. • Stationary phase has specific pore sizes. • Larger molecules elute quickly. • Smaller molecules penetrate inside the pores of the stationary phase and elute later.
Normal Phase HPLC • Stationary phase: polar, silica particles • Mobile phase: non-polar solvent or mixture of solvents • Polar compounds: • Will have a higher affinity for the polar, stationary phase • Will elute slower • Non-polar compounds: • Will have a higher affinity for the non-polar, mobile phase • Will elute faster
Reverse Phase HPLC • Stationary phase: non-polar • Non-polar organic groups are covalently attached to the silica stationary particles. • Most common attachment is a long-chain n-C18 hydrocarbon • Octadecyl silyl group, ODS • Mobile phase: polar liquid or mixture of liquids • Polar analytes will spend more time in the polar mobile phase. • Will elute quicker than non-polar analytes • Most common type of HPLC used today. http://www.lcresources.com/ resources/getstart/3a01.htm
Advantages of High Performance Liquid Chromatography • High separation capacity, enabling the batch analysis of multiple components • Superior quantitative capability and reproducibility • Moderate analytical conditions • Unlike GC, the sample does not need to be vaporized. • Generally high sensitivity • Low sample consumption • Easy preparative separation and purification of samples
Fields in Which High Performance Liquid Chromatography Is Used • Biogenic substances • Sugars, lipids, nucleic acids, amino acids, proteins, peptides, steroids, amines, etc. • Medical products • Drugs, antibiotics, etc. • Food products • Vitamins, food additives, sugars, organic acids, amino acids, etc. • Environmental samples • Inorganic ions • Hazardous organic substances, etc. • Organic industrial products • Synthetic polymers, additives, surfactants, etc.
HPLC Applications • Can be used to isolated and purify compounds for further use. • Can be used to identify the presence of specific compounds in a sample. • Can be used to determine the concentration of a specific compound in a sample. • Can be used to perform chemical separations • Enantiomers (mirror image molecular structure) • Biomolecules
HPLC Applications *HPLC has an vast amount of current & future applications* • Some uses include: • Forensics: analysis of explosives, drugs, fibers, etc. • Proteomics: can be used to separate and purify protein samples • Can separate & purify other biomolecules such as: carbohydrates, lipids, nucleic acids, pigments, proteins, steroids • Study of disease: can be used to measure the presence & abundance of specific biomolecules correlating to disease manifestation. • Pharmaceutical Research: all areas including early identification of clinically relevant molecules to large-scale processing and purification.
Electrophoresis • Electrophoresis is a separations technique that is based on the mobility of ions in an electric field. • Positively charged ions migrate towards a negative electrode and negatively-charged ions migrate toward a positive electrode. • For safety reasons one electrode is usually at ground and the other is biased positively or negatively. • Ions have different migration rates depending on their total charge, size, and shape, and can therefore be separated.
Electrophoresis • An electrode apparatus consists of a high-voltage supply, electrodes, buffer, and a support for the buffer such as filter paper, cellulose acetate strips, polyacrylamide gel, or a capillary tube. • Open capillary tubes are used for many types of samples and the other supports are usually used for biological samples such as protein mixtures or DNA fragments. • After a separation is completed the support is stained to visualize the separated components. • Resolution can be greatly improved using isoelectric focusing. In this technique the support gel maintains a pH gradient. As a protein migrates down the gel, it reaches a pH that is equal to its isoelectric point. At this pH the protein is natural and no longer migrates, i.e, it is focused into a sharp band on the gel.
Capillary Electrophoresis Schematic of capillary electrophoresis
How Does CE Work? • Capillaries are typically of 50 µm inner diameter and 0.5 to 1 m in length. The applied potential is 20 to 30 kV. • Due to electro osmotic flow, all sample components migrate towards the negative electrode. A small volume of sample (10 nL) is injected at the positive end of the capillary and the separated components are detected near the negative end of the capillary. • CE detection is similar to detectors in HPLC and include absorbance, fluorescence, electrochemical, and mass spectrometry. • The capillary can also be filled with a gel, which eliminates the electro osmotic flow. Separation is accomplished as in conventional gel electrophoresis but the capillary allows higher resolution, greater sensitivity, and on-line detection.
well Sample (blue) Gel Electrophoresis (sodium dodecyl sulfate polyacrylamide gel electrophoresis) • Is a vertical gel electropheresis • To separate proteins according to their size